Sandvik AB (SAND)

Currency in SEK
300.60
+1.20(+0.40%)
Closed·
Trading near 52-week High
SAND is not included in our AI-picked strategies. See which stocks are.
Fair Value
Day's Range
298.10301.90
52 wk Range
168.10301.90
Key Statistics
Prev. Close
299.4
Open
298.9
Day's Range
298.1-301.9
52 wk Range
168.1-301.9
Volume
1.57M
Average Volume (3m)
1.86M
1-Year Change
49.96%
Book Value / Share
72.37
Fair Value
unlockUnlock
Fair Value Upside
unlockUnlock
SAND Scorecardpro icon
Company’s Health
Unlock
Fair Value
Unlock Price
Fair Price
Upside
Price Target
289.63
Downside
-3.65%
Members' Sentiments
Bearish
Bullish
ProTips
Has raised its dividend for 3 consecutive years

Sandvik AB News & Analysis

Show more

Technical Analysis

Summary
Strong Sell
Sell
Neutral
Buy
Strong Buy
Strong Buy
Technical Indicators
Strong Buy
Moving Averages
Buy

Sandvik AB Company Profile

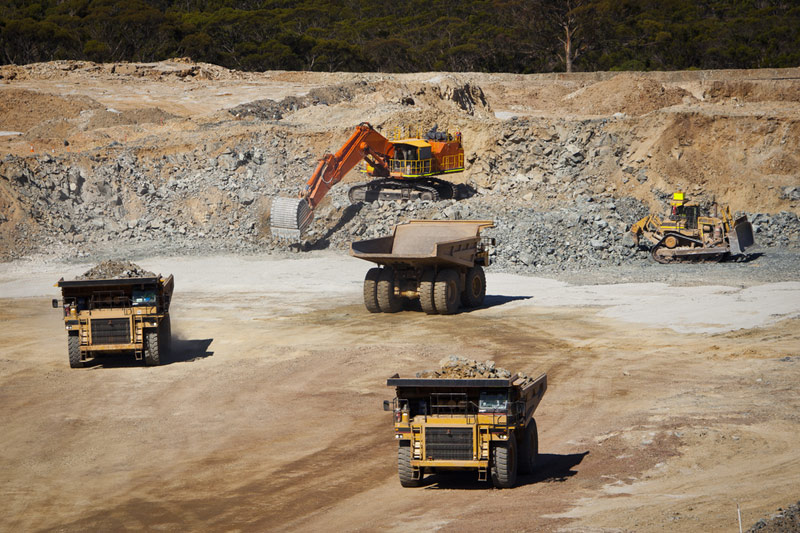
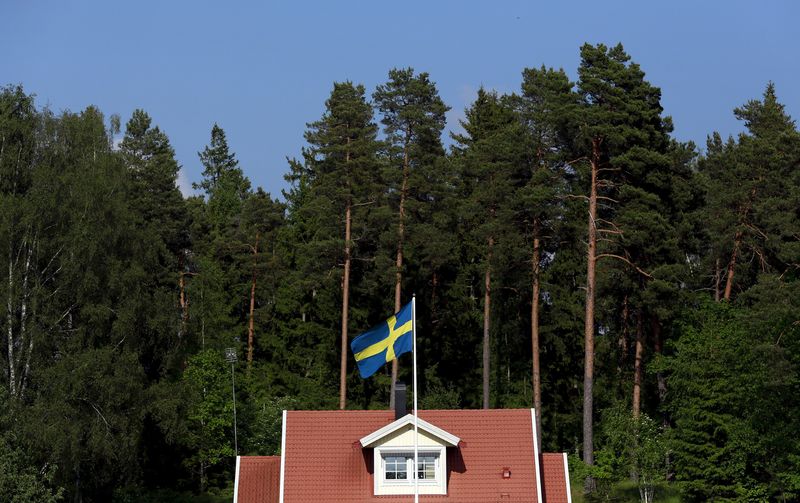
Sandvik AB (publ), an engineering company, provides products and solutions for mining and rock excavation, metal cutting, and materials technology worldwide. The company offers mining and rock excavation equipment, including drill rigs and bolters, underground loaders and trucks, mechanical cutting equipment, rock tools and rock drills, and mining automation; rock processing equipment, such as crushers, screens, hydraulic breakers, demolition tools, and breaker booms. It provides metal-cutting tools and tooling systems, and digital solutions and software; metal powder for additive manufacturing, and components made from controlled expansion alloys; and tungsten powders, as well as recycling services of secondary tungsten raw materials. It serves aerospace, automotive, energy, general engineering, infrastructure, and mining industries. Sandvik AB (publ) was founded in 1862 and is headquartered in Stockholm, Sweden.

Employees
41823
Market
Sweden

Sandvik AB Earnings Call Summary for Q3/2025

  • Order intake grew 7% with 16% organic growth; revenue down 4% but up 5% organically, driven by mining and software demand
  • Stock rose 2.55% to 277.2 USD, nearing 52-week high; year-to-date return of 118.72%
  • Strong performance in North America and Asia; continued investment in digital technologies and product innovation
  • Adjusted EBITDA at SEK 5.5 billion (19% margin); free operating cash flow of SEK 5.6 billion with 105% conversion rate
  • Positive mining outlook despite Q4 currency headwinds; extended lead times (9-12 months) reflect ongoing strong demand
Last Updated: 20/10/2025, 13:26
Read Full Transcript

Compare SAND to Peers and Sector

Metrics to compare
SAND
Peers
Sector
Relationship
P/E Ratio
25.4x25.9x12.3x
PEG Ratio
1.200.570.03
Price/Book
4.1x4.4x1.4x
Price / LTM Sales
3.1x2.9x1.3x
Upside (Analyst Target)
3.5%16.5%19.6%
Fair Value Upside
Unlock−0.6%6.6%Unlock

Analyst Ratings

12 Buy
3 Hold
4 Sell
Ratings:
19 analysts
Overall Consensus
Buy

Analysts 12-Month Price Target:

Average 289.63
(-3.65% Downside)
Firm
ArticlePositionPrice TargetUpside / DownsideFrom Price TargetActionDate
Deutsche Bank
Buy308.00+2.46%301.00Maintain08/12/2025
JPMorgan
Buy335.00+11.44%315.00Maintain04/12/2025
Goldman Sachs
Sell264.00-12.18%235.00Maintain27/10/2025
Deutsche Bank
Buy301.00+0.13%283.00Maintain23/10/2025
Rothschild Redburn
Buy335.00+11.44%275.00Upgrade21/10/2025

Dividends

Payout Ratio
Payout ratio (TTM)
Earnings retained
EPS 11.78%
Dividend Yield
1.92%
Industry Median 2.14%
Annualised payout
5.75
Paid annually
5-Years Growth
-
Growth Streak

Earnings

Latest Release
Oct 20, 2025
EPS / Forecast
2.82 / 3.01
Revenue / Forecast
29.22B / 29.81B
EPS Revisions
Last 90 days

People Also Watch

295.90
VOLVb
+0.71%
185.9
HMb
-0.16%
186.100
ANA
+0.11%
74.53
HOLX
+0.02%
350.16
SNA
-0.24%

FAQ

What Is the Sandvik AB (SAND) Share Price Today?

The live Sandvik AB share price today is 300.60

What Stock Exchange Does Sandvik AB (SAND) Trade On?

Sandvik AB is listed and trades on the Stockholm Stock Exchange.

What Is the Ticker (Stock Symbol) for Sandvik AB?

The stock symbol (also called a 'ticker') for Sandvik AB is "SAND."

Does Sandvik AB Pay Dividends? What’s The Current SAND Dividend Yield?

Yes, SAND Pays Dividends to its Shareholders. The current Sandvik AB dividend yield is 1.92%.

What Is the Current Sandvik AB Market Cap?

As of today, Sandvik AB market capitalisation is 378.45B.

What Is Sandvik AB's (SAND) Earnings Per Share (TTM)?

The Sandvik AB EPS is currently 11.78 (Trailing Twelve Months).

When Is the Next Sandvik AB Earnings Date?

Sandvik AB's next earnings report will be released on 27 Jan 2026.

Is SAND a Buy or Sell From a Technical Analyst Perspective?

Based on today's Sandvik AB moving averages and other technical indicators, the daily buy/sell signal is Strong Buy.

How Many Times Has Sandvik AB Stock Split?

Sandvik AB has split 2 times. (See the SAND stock split history page for full effective split date and price information.)

How Many Employees Does Sandvik AB Have?

Sandvik AB has 41823 employees.

What is the current trading status of Sandvik AB (SAND)?

As of 30 Dec 2025, Sandvik AB (SAND) is trading at a price of 300.60, with a previous close of 299.40. The stock has fluctuated within a day range of 298.10 to 301.90, while its 52-week range spans from 168.10 to 301.90.

What Is Sandvik AB (SAND) Price Target According to Analysts?

The average 12-month price target for Sandvik AB is SEK289.63158, with a high estimate of SEK335 and a low estimate of SEK212. 12 analysts recommend buying the stock, while 4 suggest selling, leading to an overall rating of Buy. The stock has an -3.65% Downside potential.
Risk Disclosure: Trading in financial instruments and/or cryptocurrencies involves high risks including the risk of losing some, or all, of your investment amount, and may not be suitable for all investors. Prices of cryptocurrencies are extremely volatile and may be affected by external factors such as financial, regulatory or political events. Trading on margin increases the financial risks.
Before deciding to trade in financial instrument or cryptocurrencies you should be fully informed of the risks and costs associated with trading the financial markets, carefully consider your investment objectives, level of experience, and risk appetite, and seek professional advice where needed.
Fusion Media would like to remind you that the data contained in this website is not necessarily real-time nor accurate. The data and prices on the website are not necessarily provided by any market or exchange, but may be provided by market makers, and so prices may not be accurate and may differ from the actual price at any given market, meaning prices are indicative and not appropriate for trading purposes. Fusion Media and any provider of the data contained in this website will not accept liability for any loss or damage as a result of your trading, or your reliance on the information contained within this website.
It is prohibited to use, store, reproduce, display, modify, transmit or distribute the data contained in this website without the explicit prior written permission of Fusion Media and/or the data provider. All intellectual property rights are reserved by the providers and/or the exchange providing the data contained in this website.
Fusion Media may be compensated by the advertisers that appear on the website, based on your interaction with the advertisements or advertisers.
© 2007-2025 - Fusion Media Limited. All Rights Reserved.