Epiroc AB Class A (EPIRa)

Currency in SEK
236.70
-7.90(-3.23%)
Real-time Data·
EPIRa is not included in our AI-picked strategies. See which stocks are.
Fair Value
Day's Range
234.00238.40
52 wk Range
167.55274.50
Key Statistics
Prev. Close
244.6
Open
237.4
Day's Range
234-238.4
52 wk Range
167.55-274.5
Volume
911.61K
Average Volume (3m)
1.87M
1-Year Change
11.9149%
Book Value / Share
34.96
Fair Value
unlockUnlock
Fair Value Upside
unlockUnlock
EPIRa Scorecardpro icon
Company’s Health
Unlock
Fair Value
Unlock Price
Fair Price
Upside
Price Target
235.95
Downside
-0.32%
Members' Sentiments
Bearish
Bullish
ProTips
Stock has taken a big hit over the last week

Epiroc AB Class A News & Analysis

Show more

Technical Analysis

Summary
Strong Sell
Sell
Neutral
Buy
Strong Buy
Strong Sell
Technical Indicators
Strong Sell
Moving Averages
Sell

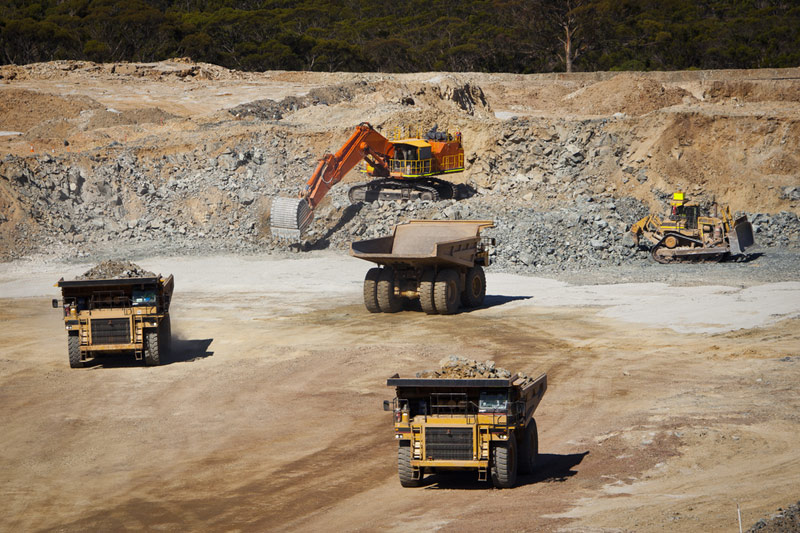
Epiroc AB (publ), together with its subsidiaries, develops and produces equipment for use in surface and underground applications in North America, Europe, South America, Europe, Africa, the Middle East, Asia, Australia, and India. It operates in two segments, Equipment & Service, and Tools & Attachments. The Equipment & Service segment provides equipment and solutions for rock drilling, rock excavation, rock reinforcement, loading and haulage, and ventilation systems, as well as drilling equipment for exploration, and water and energy; and related spare parts and services for the mining and infrastructure industries. This segment offers solutions for automation, digitalization, and electrification. The Tools & Attachments segment provides consumables for rock drilling, such as drill bits and drill rods, as well as tools for exploration drilling and rock reinforcement; ground engaging tools, such as cast lips, teeth, and protective shrouds, as well as digital solutions for the mining industry; and hydraulic attachments, including hydraulic breakers, shears and pulverizers, concrete cutters and busters, drum cutters, excavator grapples, excavator magnets, hydraulic compactors, crusher and screening buckets, auger drive units, and couplers and thumbs. In addition, the company offers aftermarket services, including new circular services, productivity-enhancing technology-agnostic digital solutions, mid-life upgrades, diesel-to-battery conversions, and remanufacturing of components. The company was founded in 1873 and is headquartered in Nacka, Sweden.

Compare EPIRa to Peers and Sector

Metrics to compare
EPIRa
Peers
Sector
Relationship
P/E Ratio
32.9x26.2x12.5x
PEG Ratio
−20.060.040.03
Price/Book
6.7x3.4x1.4x
Price / LTM Sales
4.6x1.6x1.3x
Upside (Analyst Target)
−1.9%18.8%20.8%
Fair Value Upside
Unlock−0.3%6.8%Unlock

Analyst Ratings

6 Buy
10 Hold
3 Sell
Ratings:
19 analysts
Overall Consensus
Neutral

Analysts 12-Month Price Target:

Average 235.95
(-0.32% Downside)
Firm
ArticlePositionPrice TargetUpside / DownsideFrom Price TargetActionDate
Deutsche Bank
Hold253.00+7.25%235.00Maintain05/03/2026
Citi
Buy280.00+18.69%252.00Maintain28/01/2026
Deutsche Bank
Hold235.00-0.38%219.00Maintain28/01/2026
RBC Capital
Hold230.00-2.50%200.00Maintain27/01/2026
Kepler Cheuvreux
Hold245.00+3.86%230.00Maintain27/01/2026

Dividends

Payout Ratio
Payout ratio (TTM)
Earnings retained
EPS 7.11%
Dividend Yield
1.55%
Industry Median 1.83%
Annualised payout
3.80
Paid unevenly
5-Years Growth
+8.73%
Growth Streak

Earnings

Latest Release
Jan 26, 2026
EPS / Forecast
1.91 / 1.94
Revenue / Forecast
16.09B / 16.46B
EPS Revisions
Last 90 days

People Also Watch

80.50
MWDP
-3.71%
541.60
SPL1
-1.28%
128.45
BEIJb
-2.28%
34.980
FPE3_p
-1.35%
66.375
ANDR
-2.53%

FAQ

What Is the Epiroc A (EPIRa) Share Price Today?

The Epiroc A stock price today is 236.70 SEK.

What Stock Exchange Does Epiroc A (EPIRa) Trade On?

Epiroc A is listed and trades on the Stockholm Stock Exchange.

What Is the Ticker (Stock Symbol) for Epiroc A?

The stock symbol (also called a 'ticker') for Epiroc A is "EPIRa."

Does Epiroc A Pay Dividends? What’s The Current EPIRa Dividend Yield?

Yes, EPIRa Pays Dividends to its Shareholders. The current Epiroc A dividend yield is 1.55%.

What Is the Current Epiroc A Market Cap?

As of today, Epiroc A market cap is 285.46B SEK.

What Is Epiroc A's (EPIRa) Earnings Per Share (TTM)?

The Epiroc A EPS is currently 7.11 (Trailing Twelve Months).

When Is the Next Epiroc A Earnings Date?

Epiroc A's next earnings report will be released on 29/04/2026.

Is EPIRa a Buy or Sell From a Technical Analyst Perspective?

Based on today's Epiroc A moving averages and other technical indicators, the daily buy/sell signal is Strong Sell.

How Many Times Has Epiroc A Stock Split?

Epiroc A has split 0 times. (See the EPIRa stock split history page for full effective split date and price information.)

How Many Employees Does Epiroc A Have?

Epiroc A has 19055 employees.

What is the current trading status of Epiroc A (EPIRa)?

As of 09/03/2026, Epiroc A (EPIRa) is trading at a price of 236.70 SEK, with a previous close of 244.60 SEK. The stock has fluctuated within a day range of 234.00 SEK to 238.40 SEK, while its 52-week range spans from 167.55 SEK to 274.50 SEK.

What Is Epiroc A (EPIRa) Price Target According to Analysts?

The average 12-month price target for Epiroc A is 235.95 SEK, with a high estimate of 280 SEK and a low estimate of 185 SEK. 6 analysts recommend buying the stock, while 3 suggest selling, leading to an overall rating of Neutral. The stock has an -0.32% Downside potential.
Risk Disclosure: Trading in financial instruments and/or cryptocurrencies involves high risks including the risk of losing some, or all, of your investment amount, and may not be suitable for all investors. Prices of cryptocurrencies are extremely volatile and may be affected by external factors such as financial, regulatory or political events. Trading on margin increases the financial risks.
Before deciding to trade in financial instrument or cryptocurrencies you should be fully informed of the risks and costs associated with trading the financial markets, carefully consider your investment objectives, level of experience, and risk appetite, and seek professional advice where needed.
Fusion Media would like to remind you that the data contained in this website is not necessarily real-time nor accurate. The data and prices on the website are not necessarily provided by any market or exchange, but may be provided by market makers, and so prices may not be accurate and may differ from the actual price at any given market, meaning prices are indicative and not appropriate for trading purposes. Fusion Media and any provider of the data contained in this website will not accept liability for any loss or damage as a result of your trading, or your reliance on the information contained within this website.
It is prohibited to use, store, reproduce, display, modify, transmit or distribute the data contained in this website without the explicit prior written permission of Fusion Media and/or the data provider. All intellectual property rights are reserved by the providers and/or the exchange providing the data contained in this website.
Fusion Media may be compensated by the advertisers that appear on the website, based on your interaction with the advertisements or advertisers.
© 2007-2026 - Fusion Media Limited. All Rights Reserved.