Safran SA (SAF)

Currency in EUR
324.30
-2.70(-0.83%)
Real-time Data·
SAF is not included in our AI-picked strategies. See which stocks are.
Fair Value
Day's Range
322.90325.60
52 wk Range
190.70350.80
Key Statistics
Prev. Close
327
Open
325.5
Day's Range
322.9-325.6
52 wk Range
190.7-350.8
Volume
40.05K
Average Volume (3m)
490.06K
1-Year Change
24.4342%
Book Value / Share
35.55
Fair Value
unlockUnlock
Fair Value Upside
unlockUnlock
SAF Scorecardpro icon
Company’s Health
Unlock
Fair Value
Unlock Price
Fair Price
Upside
Price Target
354.86
Upside
+9.42%
Members' Sentiments
Bearish
Bullish
ProTips
Has raised its dividend for 5 consecutive years

Safran SA News & Analysis

Show more

Technical Analysis

Summary
Strong Sell
Sell
Neutral
Buy
Strong Buy
Strong Sell
Technical Indicators
Strong Sell
Moving Averages
Strong Sell

Safran Company Profile

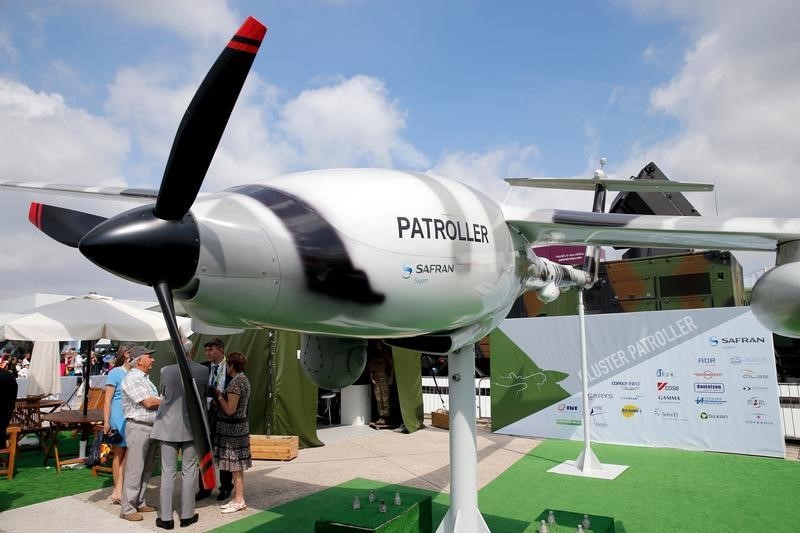
Safran SA, together with its subsidiaries, engages in the aerospace and defense businesses in France, rest of Europe, the Americas, the Asia-Pacific, Africa, and the Middle East. The company operates through three segments: Aerospace Propulsion; Aircraft Equipment, Defense and Aerosystems; and Aircraft Interiors. The Aerospace Propulsion segment designs, develops, produces, and markets propulsion and mechanical power transmission systems for commercial aircraft, military transport, training and combat aircraft, civil and military helicopters, and drones; and offers maintenance, repair, and overhaul (MRO) services, as well as sells spare parts. The Aircraft Equipment, Defense and Aerosystems segment provides landing gears and brakes; nacelles and reversers; avionics, such as flight controls and onboard information systems; security systems, including evacuation slides and oxygen masks; onboard computers and fuel systems; electrical power management systems and related engineering services; optronic equipment and sights, navigation equipment and sensors, infantry, and drones; MRO services; and sells spare parts. The Aircraft Interiors segment designs, develops, manufactures, and markets aircraft seats for passengers and crew; cabin equipment, overhead bins, class dividers, passenger service units, cabin interior solutions, chilling systems, galleys, electrical inserts, and trolleys; and cabin equipment and passenger comfort-focused solutions such as water distribution, lavatories, air systems, and in-flight entertainment and connectivity (IFEC) solutions. The company’s products and services are used in commercial civil and military aircrafts, and helicopters. Safran SA was founded in 1896 and is headquartered in Paris, France.

Employees
103710
Market
France

Compare SAF to Peers and Sector

Metrics to compare
SAF
Peers
Sector
Relationship
P/E Ratio
18.5x42.1x12.5x
PEG Ratio
0.021.360.03
Price/Book
8.9x8.0x1.4x
Price / LTM Sales
4.3x3.7x1.3x
Upside (Analyst Target)
8.4%20.6%19.6%
Fair Value Upside
Unlock−10.7%8.1%Unlock

Analyst Ratings

14 Buy
6 Hold
1 Sell
Ratings:
21 analysts
Overall Consensus
Buy

Analysts 12-Month Price Target:

Average 354.86
(+9.42% Upside)
Firm
ArticlePositionPrice TargetUpside / DownsideFrom Price TargetActionDate
Kepler Cheuvreux
Buy385.00+18.83%354.00Maintain18/02/2026
Citi
Hold342.00+5.56%275.00Maintain17/02/2026
RBC Capital
Buy400.00+23.46%340.00Maintain16/02/2026
JPMorgan
Buy400.00+23.46%375.00Maintain16/02/2026
Barclays
Buy340.00+4.94%330.00Maintain15/01/2026

Dividends

Payout Ratio
Payout ratio (TTM)
Earnings retained
EPS 17.17%
Dividend Yield
0.89%
Industry Median 1.40%
Annualised payout
2.90
Paid annually
5-Years Growth
+50.77%
Growth Streak

Earnings

Latest Release
Feb 13, 2026
EPS / Forecast
3.88 / 3.92
Revenue / Forecast
8.71B / 8.84B
EPS Revisions
Last 90 days

Safran (SAF) Income Statement & Profits

People Also Watch

250.40
TCFP
-0.12%
60.120
LDOF
-0.46%
1,638.500
RHMG
0.00%
171.82
AIRP
-0.31%
343.80
AM
-0.92%

FAQ

What Is the Safran (SAF) Share Price Today?

The Safran stock price today is 324.30 EUR.

What Stock Exchange Does Safran (SAF) Trade On?

Safran is listed and trades on the Paris Stock Exchange.

What Is the Ticker (Stock Symbol) for Safran?

The stock symbol (also called a 'ticker') for Safran is "SAF."

Does Safran Pay Dividends? What’s The Current SAF Dividend Yield?

Yes, SAF Pays Dividends to its Shareholders. The current Safran dividend yield is 0.89%.

What Is the Current Safran Market Cap?

As of today, Safran market cap is 135.86B EUR.

What Is Safran's (SAF) Earnings Per Share (TTM)?

The Safran EPS is currently 17.17 (Trailing Twelve Months).

When Is the Next Safran Earnings Date?

Safran's next earnings report will be released on 23/04/2026.

Is SAF a Buy or Sell From a Technical Analyst Perspective?

Based on today's Safran moving averages and other technical indicators, the daily buy/sell signal is Sell.

How Many Times Has Safran Stock Split?

Safran has split 2 times. (See the SAF stock split history page for full effective split date and price information.)

How Many Employees Does Safran Have?

Safran has 103710 employees.

What is the current trading status of Safran (SAF)?

As of 05/03/2026, Safran (SAF) is trading at a price of 324.30 EUR, with a previous close of 327.00 EUR. The stock has fluctuated within a day range of 322.90 EUR to 325.60 EUR, while its 52-week range spans from 190.70 EUR to 350.80 EUR.

What Is Safran (SAF) Price Target According to Analysts?

The average 12-month price target for Safran is 354.86 EUR, with a high estimate of 416 EUR and a low estimate of 257 EUR. 14 analysts recommend buying the stock, while 1 suggest selling, leading to an overall rating of Buy. The stock has an +9.42% Upside potential.
Risk Disclosure: Trading in financial instruments and/or cryptocurrencies involves high risks including the risk of losing some, or all, of your investment amount, and may not be suitable for all investors. Prices of cryptocurrencies are extremely volatile and may be affected by external factors such as financial, regulatory or political events. Trading on margin increases the financial risks.
Before deciding to trade in financial instrument or cryptocurrencies you should be fully informed of the risks and costs associated with trading the financial markets, carefully consider your investment objectives, level of experience, and risk appetite, and seek professional advice where needed.
Fusion Media would like to remind you that the data contained in this website is not necessarily real-time nor accurate. The data and prices on the website are not necessarily provided by any market or exchange, but may be provided by market makers, and so prices may not be accurate and may differ from the actual price at any given market, meaning prices are indicative and not appropriate for trading purposes. Fusion Media and any provider of the data contained in this website will not accept liability for any loss or damage as a result of your trading, or your reliance on the information contained within this website.
It is prohibited to use, store, reproduce, display, modify, transmit or distribute the data contained in this website without the explicit prior written permission of Fusion Media and/or the data provider. All intellectual property rights are reserved by the providers and/or the exchange providing the data contained in this website.
Fusion Media may be compensated by the advertisers that appear on the website, based on your interaction with the advertisements or advertisers.
© 2007-2026 - Fusion Media Limited. All Rights Reserved.