- US futures repeat yesterday’s pattern of attempting to force a rise, while global stocks fall
- Investors torn between hopes and pessimism of a v-shaped recovery
- Oil prices surge
- U.S. weekly jobless claims are due later today.
- On Friday, China releases industrial production and retail sales data for April.
- Futures on the S&P 500 Index climbed 0.1%.
- The Stoxx Europe 600 Index dipped 0.9%.
- The MSCI Asia Pacific Index fell 1.4%.
- The MSCI Emerging Markets Index fell 1%.
- The Dollar Index rose 0.1%.
- The euro dipped 0.1% to $1.0808.
- The British pound sank 0.2% to $1.2202.
- The onshore yuan weakened 0.1% to 7.098 per dollar.
- The Japanese yen strengthened 0.2% to 106.83 per dollar.
- The yield on 10-year Treasuries sank three basis points to 0.63%.
- The yield on two-year Treasuries climbed less than one basis point to 0.16%.
- Germany’s 10-year yield fell one basis point to -0.54%.
- Britain’s 10-year yield declined one basis point to 0.2%.
- Japan’s 10-year yield dipped less than one basis point to -0.003%.
- West Texas Intermediate crude gained 2.3% to $25.86 a barrel.
- Brent crude gained 2.3% to $29.85 a barrel.
- Gold was little changed at $1,716.76 an ounce.
Key Events
US futures for the Dow Jones, S&P 500, NASDAQ and Russell 2000 wobbled on Thursday, as European shares declined, tracking Asian markets which all closed lower. The fact that life—and global economies—may not be snapping back to pre-coronavirus norms seems to now be weighing on traders, after Fed Chair Jerome Powell said yesterday that the current outlook right is “highly uncertain and subject to significant downside risks.”
Investors fled to safe havens overnight: the dollar, Treasuries, gold and Bitcoin were up. Oil surged on a multi-percent level.
Global Financial Affairs
This morning, US futures replicated yesterday's pattern, attempting to push higher despite losses in Asia and Europe.
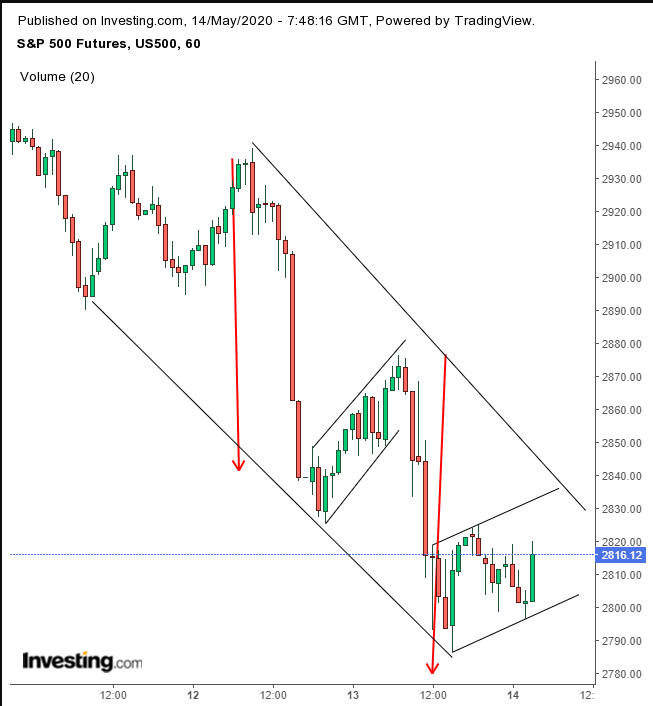
The supply-demand balance shifted from one-sided optimism that economies were reopening and a V-shaped recovery was on the horizon, to evidence-based pessimism after Fed boss Jerome Powell warned that the economy will likely continue to shrink without additional government help.
Futures on the S&P 500 were up earlier this morning, but at time of writing had turned lower. We expect them to continue a decline, in its back-to-back hourly rising flags.
Automobile makers and the technology industry pulled down the Stoxx Europe 600 Index.
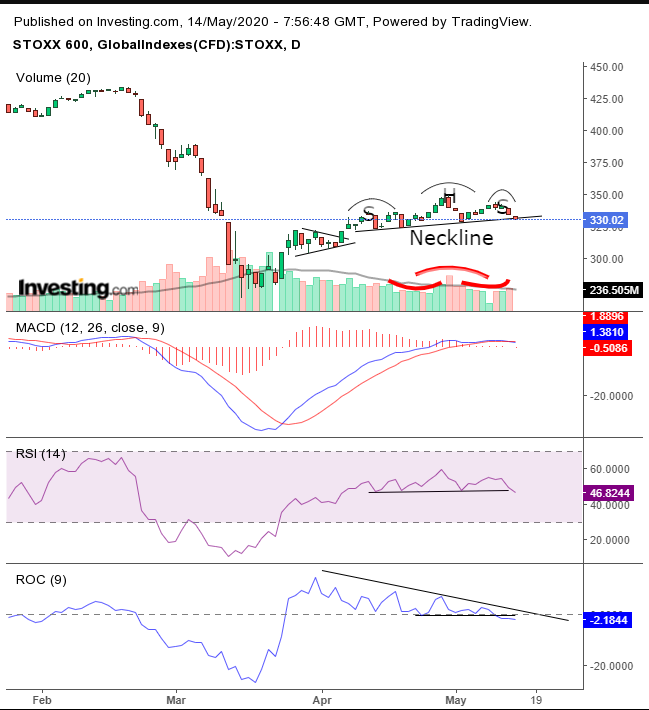
From a technical perspective, the pan-European benchmark is fluctuating—flipping above and below the dividing line between bulls and bears, forming the neckline of a H&S top. Trading volume has been deteriorating with each rally within the pattern, while rising along the dips, creating a mirror-image to the price action and demonstrating where the power is.
This negative divergence can also be seen via the longer-term price action: when prices collapsed because of the COVID-19 scare, volume spiked. But since the dead-cat bounce in March, volume has been collapsing, therefore not supporting the price advance. As well, the RSI and ROC are breaking down, and the MACD is turning into a bearish signal.
Asian trading flashed bright red across the digital boards earlier Thursday. India’s BSE Sensex 30 underperformed, (-2.7%), giving back almost all of yesterday's gains. While the Indian benchmark provided today's worst performance in Asia session, it remains positive over the past two days, + 0.1%, which is much better than the losses endured by other regional indices.
Japan’s Nikkei 225, (-1.7%), and Australia’s ASX 200, (-1.7%), had the greatest losses after the Indian index. China’s Shanghai Composite continued to do relatively better than peers, (-1%); the only regional index that did better was South Korea’s KOSPI (-0.8%).
During Wednesday's New York session, US equities fell to a three-week low. The S&P 500 lost close to 2%.
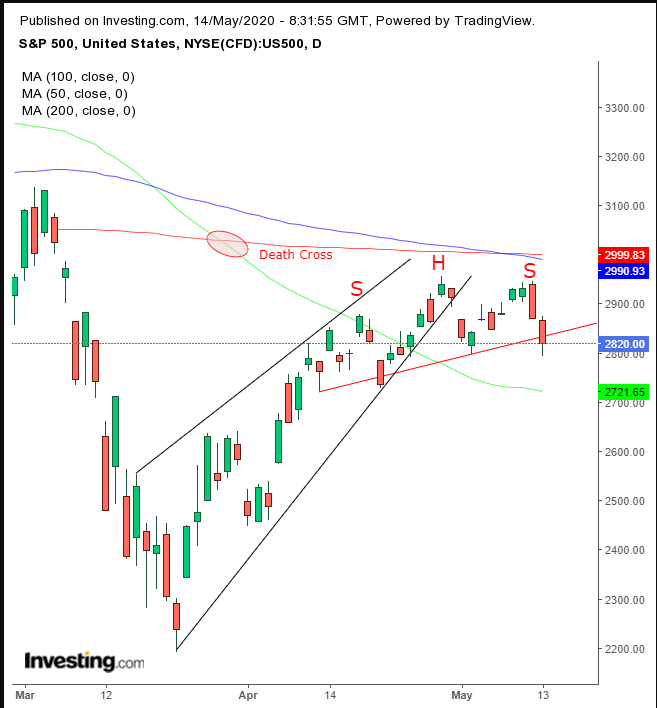
The US benchmark dipped below the 2,800 support, its lowest level in almost a month. The index still completed a H&S top, after completing a rising wedge. However, the downside breakout is miniscule, a classic setup for a bear trap. Proceed cautiously.
As economic and global health realities continue to depress sentiment, more big-name investors are turning pessimistic on equities, increasingly considering them vastly overvalued.
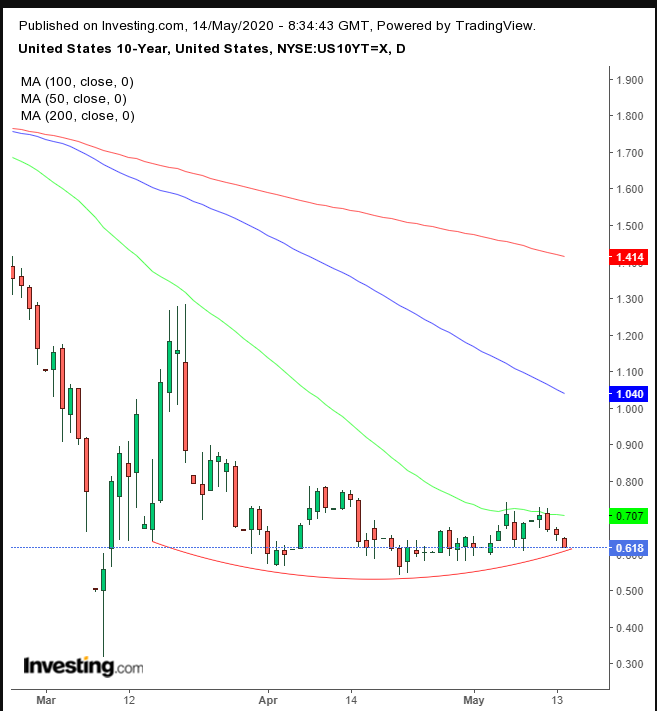
The 10-year US Treasury rose for the third straight day, pushing yields to a month-long rounding support.
The dollar followed Treasurys higher.
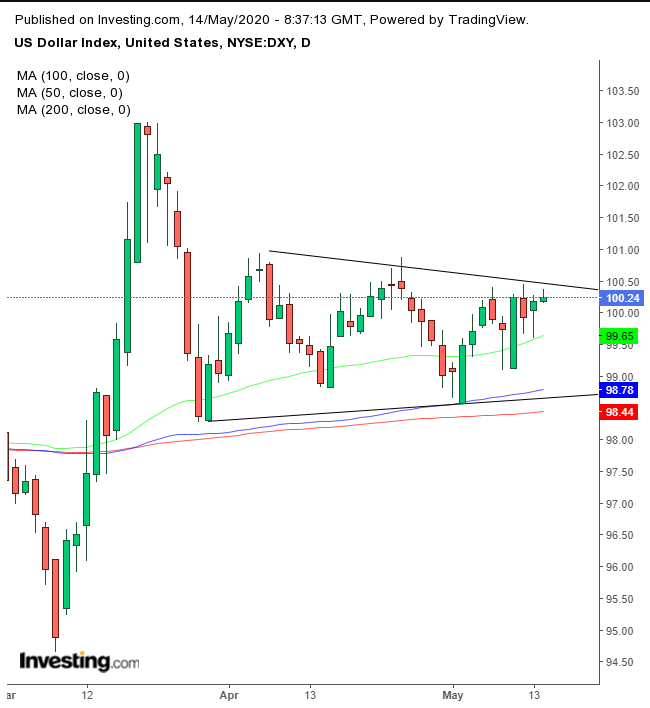
The USD is pushing against the top of a range since late-March. An upside breakout would demonstrate that buyers are increasing their bids to find new, willing sellers above the prices within the pattern.
Gold broke through the topside of a pattern that can be interpreted in a variety of ways.
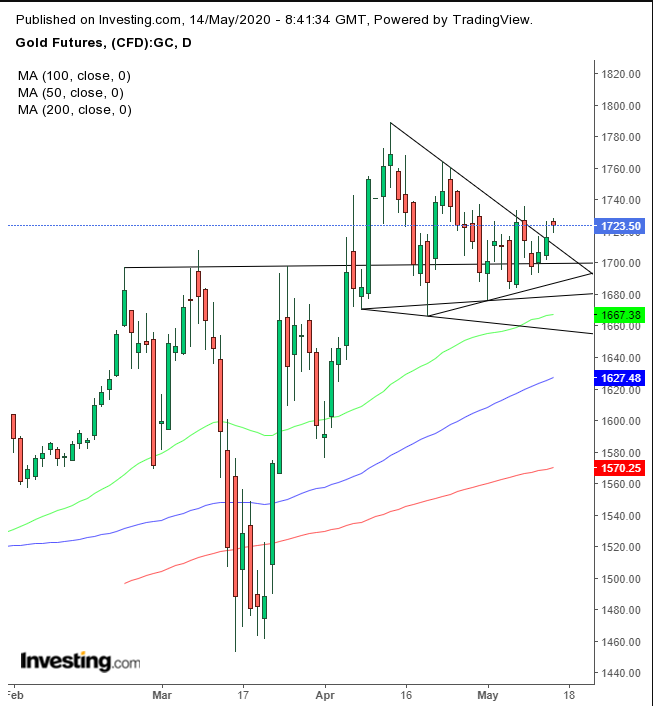
It could be viewed as a descending triangle, a pennant or falling wedge. Whichever it is, a sustained upside breakout would both be a bullish signal in its own merit, compounded by confirmation to the H&S continuation pattern that preceded it.
Bitcoin is above its falling channel since the June top, for the second time since last week.
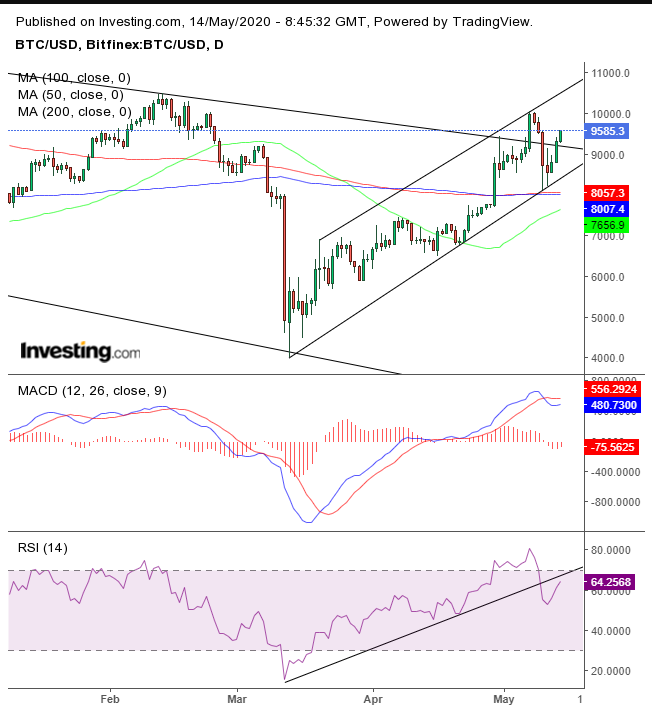
Nevertheless, the cryptocurrency remains within the rising channel since the March bottom. Both the MACD and the RSI suggest the longer channel will dominate.
On its technical chart, crude oil appears to be clawing itself back to where it was before Wednesday’s drop. The price surged to $26.41, up more than 4.0%
