Aurubis AG (NAFG)

Currency in EUR
187.450
-2.850(-1.50%)
Real-time Data·
NAFG is not included in our AI-picked strategies. See which stocks are.
Fair Value
Day's Range
186.750188.550
52 wk Range
76.200212.600
Key Statistics
Prev. Close
190.3
Open
188.45
Day's Range
186.75-188.55
52 wk Range
76.2-212.6
Volume
7.37K
Average Volume (3m)
190.6K
1-Year Change
140.9383%
Book Value / Share
132.07
Fair Value
unlockUnlock
Fair Value Upside
unlockUnlock
NAFG Scorecardpro icon
Company’s Health
Unlock
Fair Value
Unlock Price
Fair Price
Upside
Price Target
167.750
Downside
-10.51%
Members' Sentiments
Bearish
Bullish
ProTips
Trading at a low P/E ratio relative to near-term earnings growth

Aurubis AG News & Analysis

Show more

Technical Analysis

Summary
Strong Sell
Sell
Neutral
Buy
Strong Buy
Strong Sell
Technical Indicators
Strong Sell
Moving Averages
Strong Sell

Analyst Ratings

2 Buy
4 Hold
2 Sell
Ratings:
8 analysts
Overall Consensus
Neutral

Analysts 12-Month Price Target:

Average 167.750
(-10.51% Downside)
Firm
ArticlePositionPrice TargetUpside / DownsideFrom Price TargetActionDate
Deutsche Bank
Hold178.00-4.99%168.00Maintain12/05/2026
Deutsche Bank
Hold168.00-10.33%153.00Maintain17/04/2026
Morgan Stanley
Hold151.00-19.40%130.00Upgrade08/04/2026
UBS
Hold160.00-14.60%170.00Maintain27/03/2026
UBS
Hold170.00-9.26%120.00Maintain06/02/2026

Earnings

Latest Release
11/05/2026
EPS / Forecast
2.15 / 2.32
Revenue / Forecast
6.04B / 6.51B
EPS Revisions
Last 90 days

Dividends

Payout Ratio
Payout ratio (TTM)
Earnings retained
EPS 21.09%
Dividend Yield
0.84%
Industry Median 2.10%
Annualised payout
1.60
Paid annually
5-Years Growth
+4.24%
Growth Streak

Compare NAFG to Peers and Sector

Metrics to compare
NAFG
Peers
Sector
Relationship
P/E Ratio
9.0x21.2x3.2x
PEG Ratio
0.280.230.00
Price/Book
1.4x1.9x1.6x
Price / LTM Sales
0.4x1.5x1.3x
Upside (Analyst Target)
−11.6%10.2%32.0%
Fair Value Upside
Unlock−0.1%0.2%Unlock

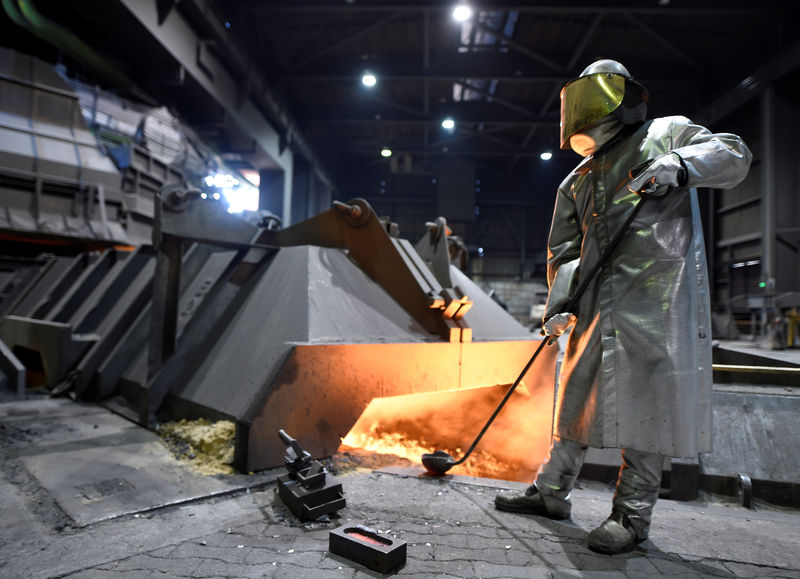
Aurubis AG processes metal concentrates and recycling materials in Germany. The company engages in processing of scrap metals, organic and inorganic metalbearing recycling raw materials, and industrial residues. It also offers copper cast rods and specialty wires, shapes, bars and profiles, industrial rolled products, and architectural rolled products. In addition, the company produces gold, silver, tin, lead, lead-bismuth alloy, lead-antimony litharge, tellurium metals, and tellurium dioxide. Further, the company engages in the recycling of copper and alloy scrap; printed circuit board and electronic scrap; mixed heavy metal fractions and shredder; residues, slimes, and sludges; preciouse metal recycling material; tin scrap; and copper iron and bimetal scrap. Additionally, it provides sulfuric acid, iron-silicate, smelter intermediates, and selenium, as well as produces various products from purchased copper and copper alloy scrap, electronic scrap, and industrial residues. The company was formerly known as Norddeutsche Affinerie AG and changed its name to Aurubis AG in April 2009. Aurubis AG was incorporated in 1866 and is headquartered in Hamburg, Germany.

Employees
7239
Market
Germany

Ownership

Ownership Overview

Type
Common Stock Held% of Shares OutstandingMarket Value
Mutual Funds & ETFs
8.68M19.88%1.66B
Other Institutional Investors
25.09M57.48%4.80B
Public Companies & Retail Investors
9.88M22.64%1.89B
Total
43.66M100.00%8.35B

Top Holders

Holder
% of holding
Shares Held
Date Reported
Value (In 1,000s)
Salzgitter AG30.89%13,487,0172,578,718
Rossmann Beteiligungs GmbH12.55%5,480,5001,047,872

People Also Watch

96.70
WCHG
-0.41%
184.000
ELGG
+5.26%
32.08
FTKn
+3.35%
128.40
VU
+3.30%
10.15
DBG
+2.53%

FAQ

What Is the Aurubis AG (Xetra: NAFG) Share Price Today?

The Aurubis AG stock price today is 187.450 EUR.

What Stock Exchange Does Aurubis AG (NAFG) Trade On?

Aurubis AG is listed and trades on the Frankfurt Stock Exchange.

What Is the Ticker (Stock Symbol) for Aurubis AG?

The stock symbol (also called a 'ticker') for Aurubis AG is "NAFG."

Does Aurubis AG Pay Dividends? What’s The Current NAFG Dividend Yield?

Yes, NAFG Pays Dividends to its Shareholders. The current Aurubis AG dividend yield is 0.84%.

What Is the Current Aurubis AG Market Capitalisation?

As of today, Aurubis AG (Xetra: NAFG) market cap is 8.220B EUR.

What Is Aurubis AG's (NAFG) Earnings Per Share (TTM)?

The Aurubis AG EPS is currently 21.090 (Trailing Twelve Months).

When Is the Next Aurubis AG Earnings Date?

Aurubis AG's next earnings report will be released on 06/08/2026.

Is NAFG a Buy or Sell From a Technical Analyst Perspective?

Based on today's Aurubis AG moving averages and other technical indicators, the daily buy/sell signal for NAFG stock is Neutral.

How Many Times Has Aurubis AG Stock Split?

Aurubis AG has split 0 times. (See the NAFG stock split history page for full effective split date and price information.)

How Many Employees Does Aurubis AG Have?

Aurubis AG has 7239 employees, based on their latest Companies House report.

What is the current trading status of Aurubis AG (Xetra: NAFG)?

As of 21/05/2026, Aurubis AG (NAFG) is trading at a share price of 187.450 EUR, with a previous close of 190.300 EUR. The stock has fluctuated within a day range of 186.750 EUR to 188.550 EUR, while its 52-week range spans from 76.200 EUR to 212.600 EUR.

What Is Aurubis AG (NAFG) Price Target According to Analysts?

The average 12-month price target for Aurubis AG is 167.750 EUR, with a high estimate of 220 EUR and a low estimate of 112 EUR. 2 analysts recommend buying the stock, while 2 suggest selling, leading to an overall rating of Neutral. The stock has an -10.51% Downside potential.
Risk Disclosure: Trading in financial instruments and/or cryptocurrencies involves high risks including the risk of losing some, or all, of your investment amount, and may not be suitable for all investors. Prices of cryptocurrencies are extremely volatile and may be affected by external factors such as financial, regulatory or political events. Trading on margin increases the financial risks.
Before deciding to trade in financial instrument or cryptocurrencies you should be fully informed of the risks and costs associated with trading the financial markets, carefully consider your investment objectives, level of experience, and risk appetite, and seek professional advice where needed.
Fusion Media would like to remind you that the data contained in this website is not necessarily real-time nor accurate. The data and prices on the website are not necessarily provided by any market or exchange, but may be provided by market makers, and so prices may not be accurate and may differ from the actual price at any given market, meaning prices are indicative and not appropriate for trading purposes. Fusion Media and any provider of the data contained in this website will not accept liability for any loss or damage as a result of your trading, or your reliance on the information contained within this website.
It is prohibited to use, store, reproduce, display, modify, transmit or distribute the data contained in this website without the explicit prior written permission of Fusion Media and/or the data provider. All intellectual property rights are reserved by the providers and/or the exchange providing the data contained in this website.
Fusion Media may be compensated by the advertisers that appear on the website, based on your interaction with the advertisements or advertisers.
© 2007-2026 - Fusion Media Limited. All Rights Reserved.