- U.S. futures climb as investors cling onto trade optimism—for how much longer?
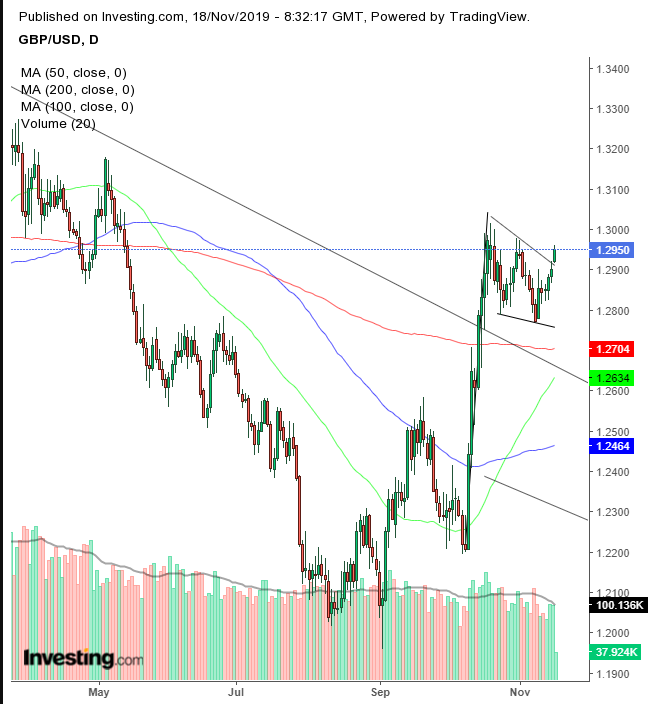
- British pound completes bullish pattern as PM Johnson wins full party's support for Brexit deal
- Hong Kong's shares outperform, defying ongoing turmoil
- Saudi Aramco IPO misses $2 trillion target
Key Events
Futures on the S&P 500, Dow and NASDAQ 100 climbed this morning, as investors remained hopeful for an upcoming breakthrough in U.S.-China trade negotiations. SPX contracts in particular signaled the underlying index may push toward another record later today, after six weeks of gains—the longest bullish run in two years. Will traders be able to maintain their optimism for much longer, even against no concrete progress?

In Europe, the pound completed a bullish technical pattern after British Prime Minister Boris Johnson said he had full support from Conservative MPs for his Brexit plan, as the party consolidated its lead in the latest polls, less than a month before general elections take place.
The STOXX 600 sealed some solid gains despite the fact an earlier rally on Spain’s IBEX 35 reversed, while France’s CAC 40 and Germany’s DAX slipped lower.
In the earlier Asian session, Japan’s Nikkei 225 (+0.49%) and China’s Shanghai Composite (+0.62) gained ground while South Korea’s KOSPI (-0.07%) and Australia’s S&P/ASX 200 (-0.40%) retreated.
Hong Kong’s Hang Seng (+1.35%) was the clear regional outperformer, despite ongoing civil unrest. Perhaps Alibaba's (HK:9988) Hong Kong listing gave traders a reason to buy the dip.
Global Financial Affairs

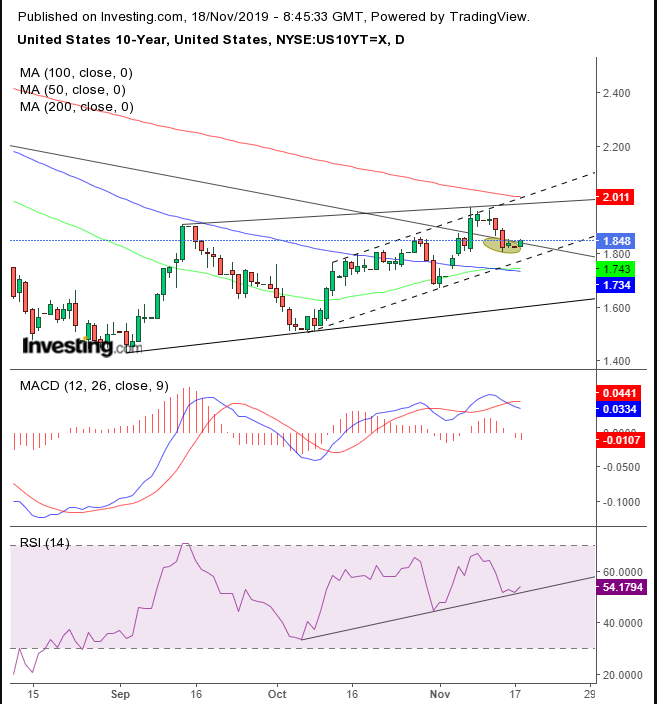
The yield on 10-year Treasurys extended a minor rebound, as it fluctuated around the downtrend line since November 2018, after falling back on it, having reached the top of a short-term rising channel, resisted by the 200 DMA. Overall, technical indicators remained mixed: the MACD provided a sell signal, while the RSI posted a buying signal.

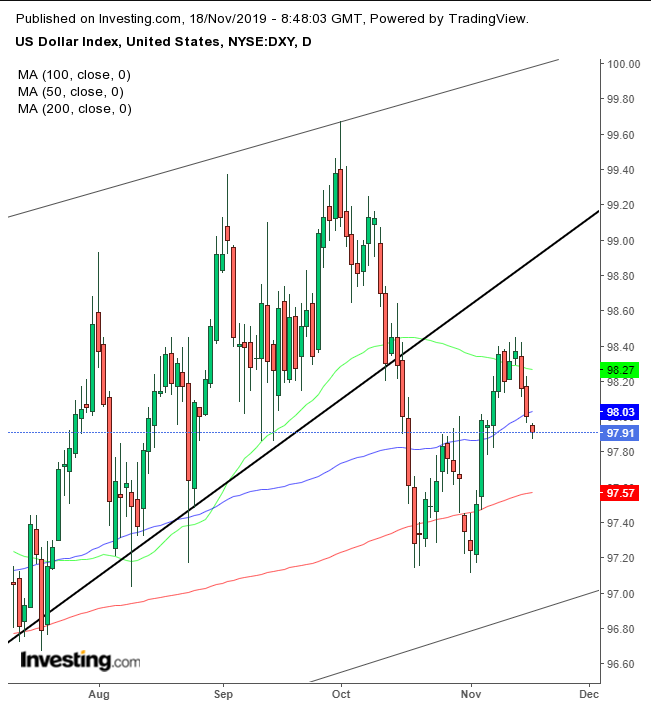
The dollar was seen falling for the third day, having dropped below both the 50 DMA and 100 DMA as it headed toward the 200 DMA. While the fall demonstrates resistance below the broken uptrend line (bold) since the February 2018 bottom, the greenback still trades within a rising channel since August, supported by the 200 DMA.
The Chinese yuan dropped while local government bonds advanced after the country’s central bank lowered some borrowing costs.
In the commodities space, WTI slipped after Saudi Arabia set a valuation target for Aramco’s Initial Public Offering (IPO) well below Crown Prince Mohammed bin Salman’s $2 trillion target, thereby trimming the size of the sale.
Up Ahead
- Corporate earnings coming up this week feature retailers including: Home Depot (NYSE:HD), TJX Companies (NYSE:TJX), Target (NYSE:TGT), Macy’s (NYSE:M) and Foot Locker (NYSE:FL).
- U.S. economic indicators due for release include foreign Treasurys holdings on Monday, housing starts on Tuesday and initial jobless claims on Thursday.
- The U.K. holds its first televised leadership debate before next month’s election on Tuesday.
- Federal Reserve speakers this week include district bank presidents John Williams, Loretta Mester and Neel Kashkari.
- On the other side of the Atlantic, European Central Bank speakers include President Christine Lagarde, Bundesbank chief Jens Weidmann, along with Yves Mersch, Luis de Guindos, Pablo Hernandez de Cos and Philip Lane.
- Chinese officials announce prime loan rates, a benchmark for borrowing costs, on Wednesday.
Market Moves
Stocks
Currencies
Bonds
Commodities
