- Bitcoin rebounded to the $36,000 levels after Monday’s steep declines
- Twitter plunged over 6% after permanently banning Trump
- Facebook dropped 4%
- The EIA {{0|crude oil inventory report is due Wednesday.
- European Central Bank President Christine Lagarde speaks at an online conference Wednesday.
- US CPI figures are due Wednesday.
- Presiden-elect Biden plans to lay out proposals for fiscal support on Thursday.
- Fed Chair Jerome Powell takes part in a webinar on Thursday.
- US initial jobless claims data are due Thursday.
- US retail sales, industrial production, business inventories and consumer sentiment figures are released Friday.
- Futures on the S&P 500 Index increased 0.1%.
- The Stoxx 600 Index gained 0.2%.
- The MSCI Asia Pacific Index climbed 0.3%.
- The MSCI Emerging Markets Index rose 0.2%.
- The Dollar Index decreased 0.1% to 90.35.
- The euro was little changed at $1.2158.
- The British pound climbed 0.2% to $1.3547.
- The Japanese yen strengthened 0.1% to 104.20 per dollar.
- The yield on 10-year Treasuries rose less than one basis point to 1.15%.
- The yield on two-year Treasuries was unchanged at 0.14%.
- Germany’s 10-year yield rose one basis point to -0.49%.
- Britain’s 10-year yield climbed one basis point to 0.32%.
- West Texas Intermediate crude gained 0.8% to $52.60 a barrel.
- Gold strengthened 0.7% to $1,857.30 an ounce.
Key Events
Futures contracts on the Dow, S&P, NASDAQ and Russell 2000 found their footing on Tuesday morning and global shares recovered from the last session selloff as the outlook for additional US fiscal support outweighed concerns on Wednesday's vote to impeach President Donald Trump or upcoming US earnings results.
Treasury yields continue their march north, while gold is starting to recover.
Global Financial Affairs
All four major US contracts were modestly higher, with those on the Russell 2000 in the lead, after the underlying index outperformed on Monday, when tech bulls dug in their heels during the Wall Street session, to endure a modest decline of less than 0.1%.
In Europe on Tuesday, the STOXX 600 Index advanced, driven by oil & gas and travel & leisure shares. These sectors took the worst hit during coronavirus lockdowns and therefore have the most to gain in the advent of a return to a normal economy. The rebound shows that investors are putting their eggs in the COVID-19 vaccine basket, disregarding the rampant virus infection rates that continue to stifle the recovery.
Oil producers BP (LON:BP), Royal Dutch Shell (LON:RDSa) and Total SA (PA:TOTF) rebounded from Monday’s selloff. The recovery was sparked by China, the world’s largest oil importer, enforcing a strict lockdown in areas surrounding Beijing, after there was a COVID-19 outbreak in the city of Langfang, in Hebei. Today’s gains were also on expectations of a US stockpile drawdown during today's weekly API release.
The fundamental narrative for this morning's European risk-on is that yesterday, traders cashed in profits they incurred after the Blue Sweep in Georgia's US Senate runoffs repaved the path to additional fiscal stimulus, the trigger for last week’s share price advances. However, the STOXX 600 may experience further pressure, based on the technicals.
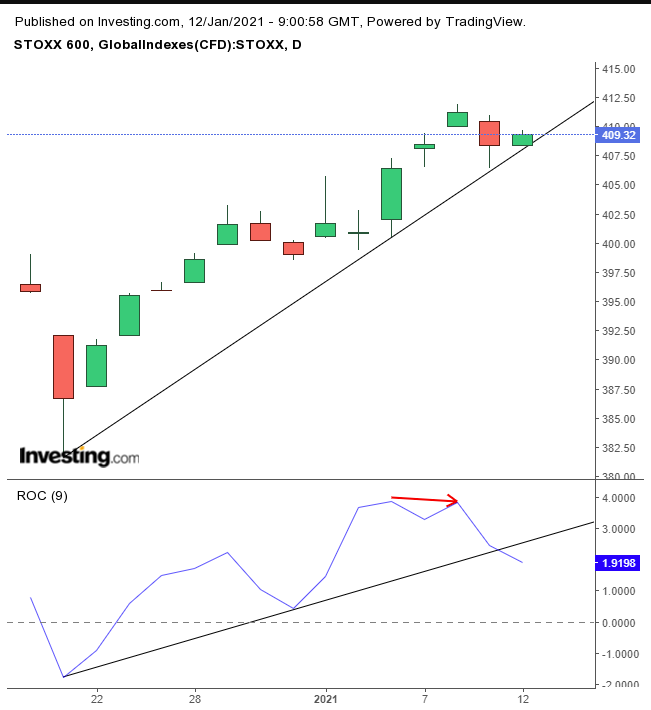
On Monday, the pan-European gauge may have completed an Evening Star—a three-candle pattern reversal, backed by a peaking ROC following a negative divergence. Though bulls fought back bravely, by closing well off session lows—the top of Thursday’s first candle of the pattern—and today they picked up where they left off, pushing off the uptrend line. Friday’s highs will be the test of whether the bullish counterattack will prevail or whether bears are biding their time, ahead of a second attempt to push the price below its uptrend line since the Dec. 21 low.
Stocks in Asia were mixed on Tuesday, with China’s Shanghai Composite (+2.2%) outperforming among the major regional gauges. The blue-chip CSI 300 Index surged to a 13-year high, inching toward its October 2007 record. This benchmark is enjoying its best ever start to a year, now that its nemesis, US President Donald Trump is almost out of the picture.
Hong Kong’s Hang Seng jumped 1.3%, nearing a yearly high, boosted by continued capital inflows from the mainland.
US shares dropped Monday for the first time in five days. Investors seemed to experience a rare pang of consciousness as prices hovered near their most expensive in history, ahead of earnings season which starts in earnest on Friday when JPMorgan Chase (NYSE:JPM), Citigroup (NYSE:C) and Wells Fargo (NYSE:WFC) all report. More likely the selloff was a healthy correction on profit-taking in the aftermath of last week’s strong performance. Still, investors could find more value at this point in the obvious place—the tech sector.
Real estate and consumer discretionary stocks weighed on the S&P 500 Index, while energy firms offset steeper losses. Eli Lilly (NYSE:LLY) propped up healthcare stocks after its shares jumped 12%, hitting a new record, after trials showed its Alzheimer's drug, "slowed the rate of decline in patients."
Twitter (NYSE:TWTR) plummeted 6.4% after the platform permanently banned President Trump on Monday following a riot caused by a mob of his supporters storming the Capitol. Facebook (NASDAQ:FB), which also suspended Trump’s account, dropped 4%. Without getting into the politics, this controversial decision—which angered conservatives—may be a breakthrough toward a discussion and regulations on social media platforms.
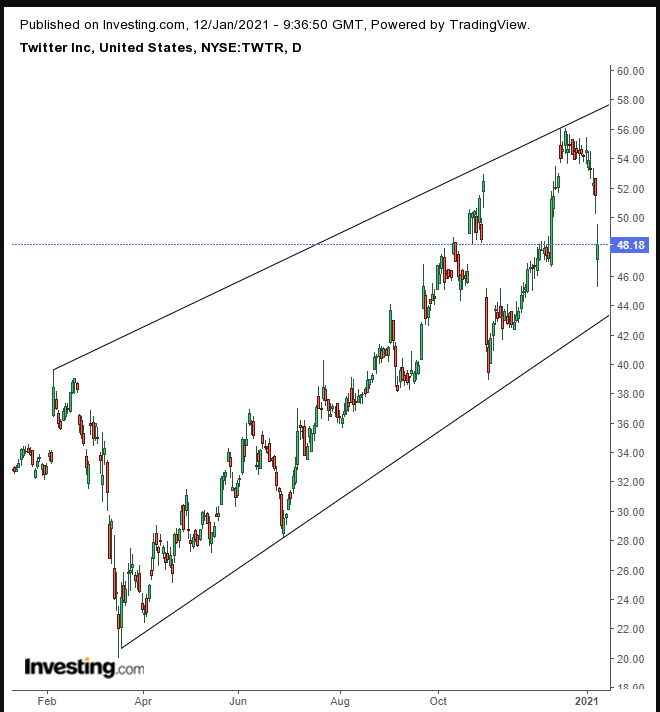
In terms of investing, Twitter’s decline, although exacerbated by politics, is within the normal path of a corrective move within an uptrend, while Facebook—already beset by antitrust problems—seems to be topping out.
Yields, including on the 10-year note, climbed for the sixth day, demonstrating that investors are comfortable with the direction of stocks.
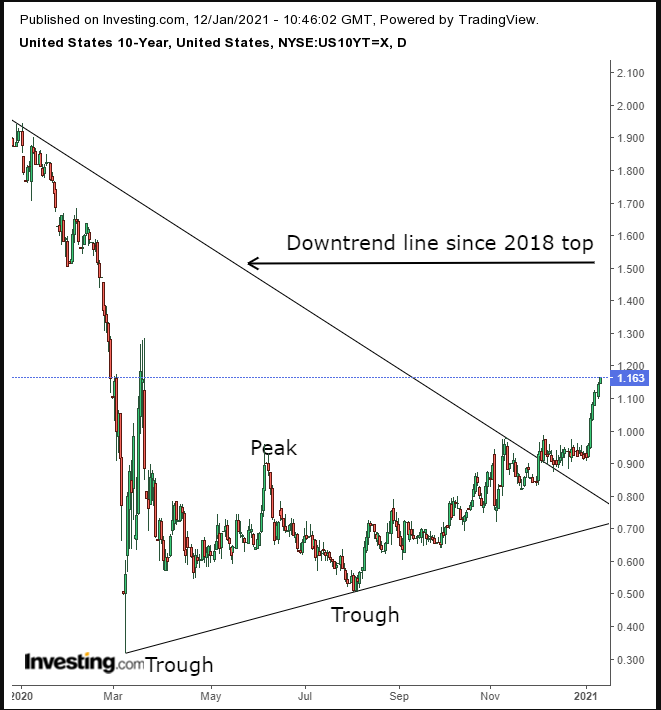
This is the longest selloff in Treasuries since the 7-day yield advance, that ended on Oct. 22. Rates surpassed the 1.15 yield, the highest since mid-March.
The dollar, however, gave up a five-day advance, turning into a decline, despite support by elevated Treasury yields.
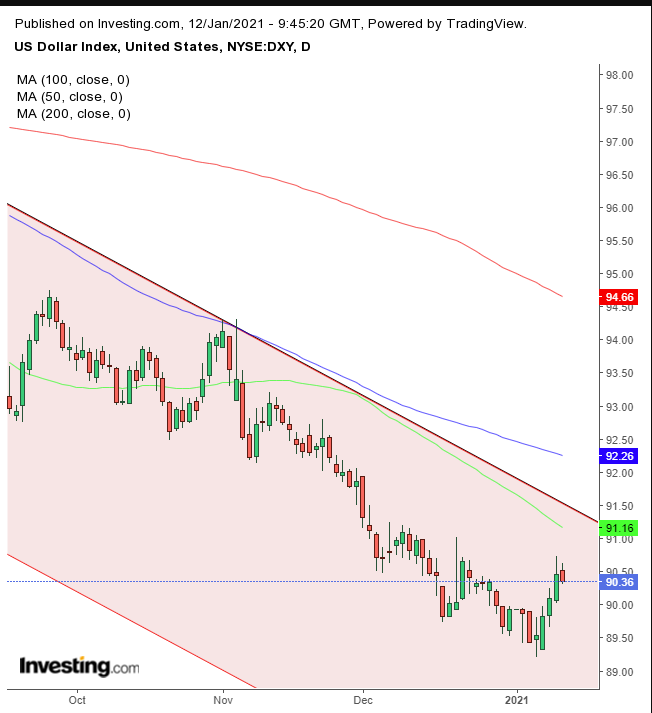
Technically, the greenback is trading within a downtrend since the currency's March peak.
Gold is showing signs of life today, as it rebounds despite risk-on. On Monday it rebounded from a steep selloff into gains, even as the dollar continued to strengthen. Finally, and even after much talk about Bitcoin siphoning capital away from gold, the yellow metal advanced. It rose yesterday as Bitcoin weakened, but is continuing to rise even as Bitcoin recovers today.
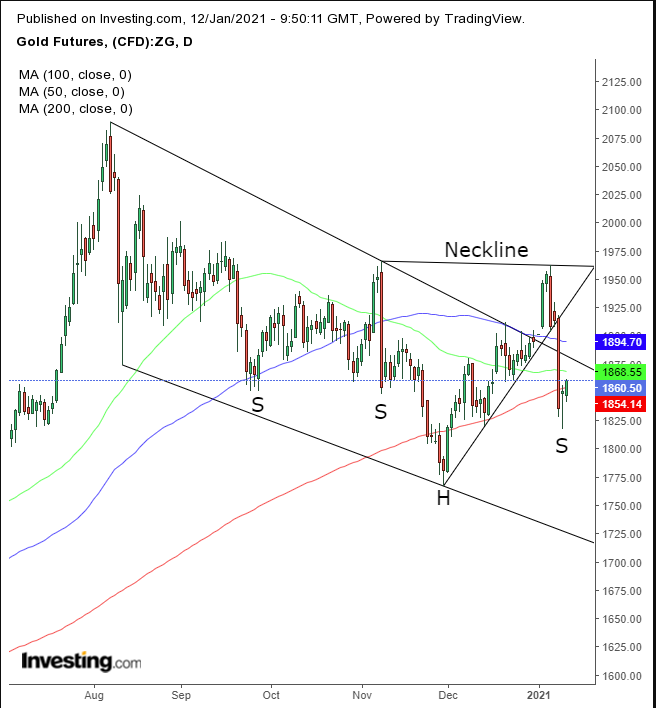
From a technical perspective, gold is building on yesterday’s hammer, as it climbs back over the 200 DMA, a support since May 2019 as it potentially trades along a complex H&S pattern.
Bitcoin has been wavering below the $36,000 level, slightly above yesterday’s close. On Monday, the digital asset suffered a 16.7% plunge but managed to close at less than half that, for a loss of 7.2%, respecting the Fibonacci’s minimum retracement and the price’s uptrend line.
Oil climbed above $53—and is trading at the very top of the session for good measure—for the first time since Feb. 21, ahead of Wednesday’s official report, which is expected to show a drawdown.
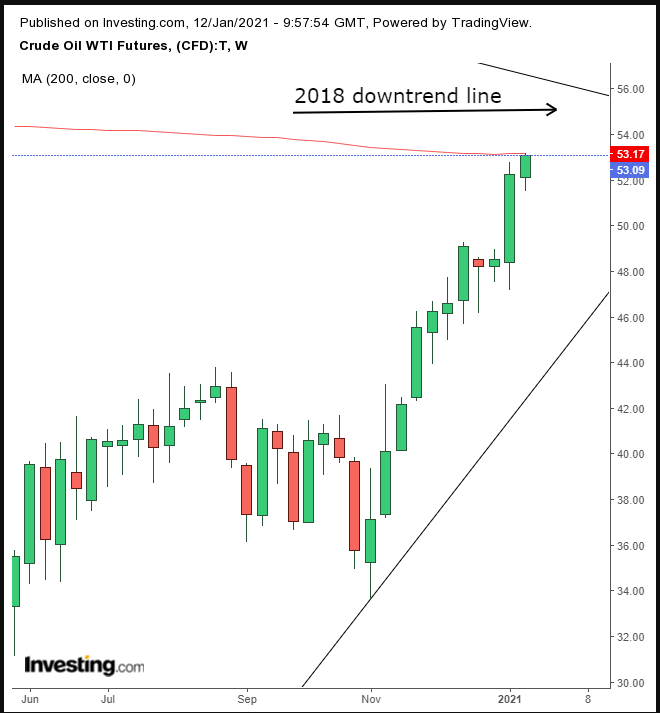
The price found resistance by the 200-week MA, a staunch support between May 2019 and January 2020, turning into resistance in February. The price is also nearing its downtrend line since the October 2018 high.
Up Ahead
Market Moves
Stocks
Currencies
Bonds
Commodities
