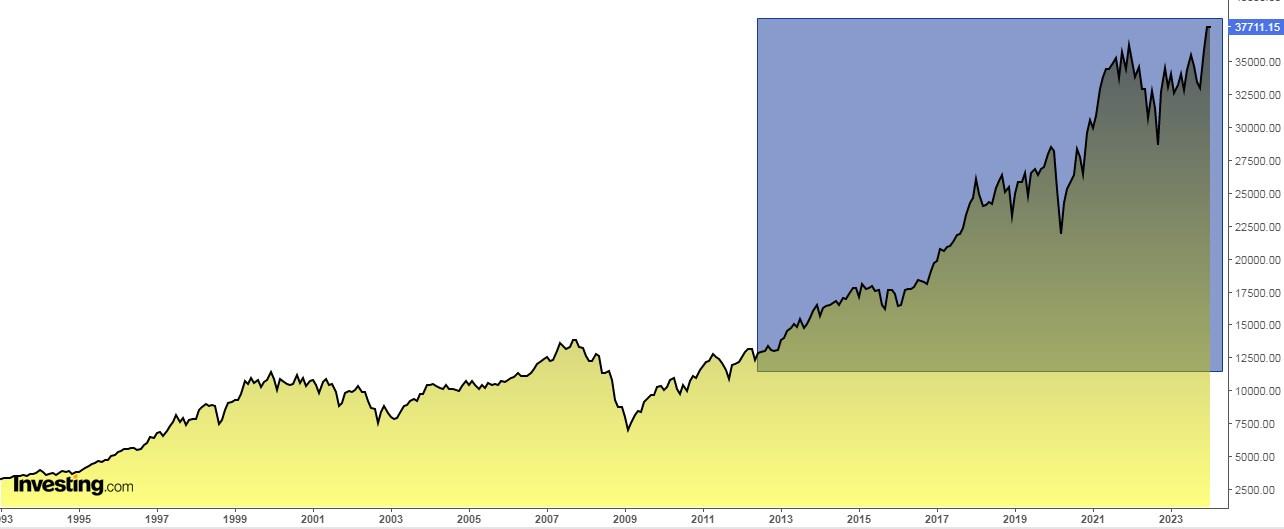
- The Dow Jones, setting all-time highs in 2023 and early 2024, has now extended its streak to an impressive 12 consecutive years.
- Additionally, Wall Street is eyeing Cathie Wood's ARK Innovation ETF stocks, expecting strong growth in 2024.
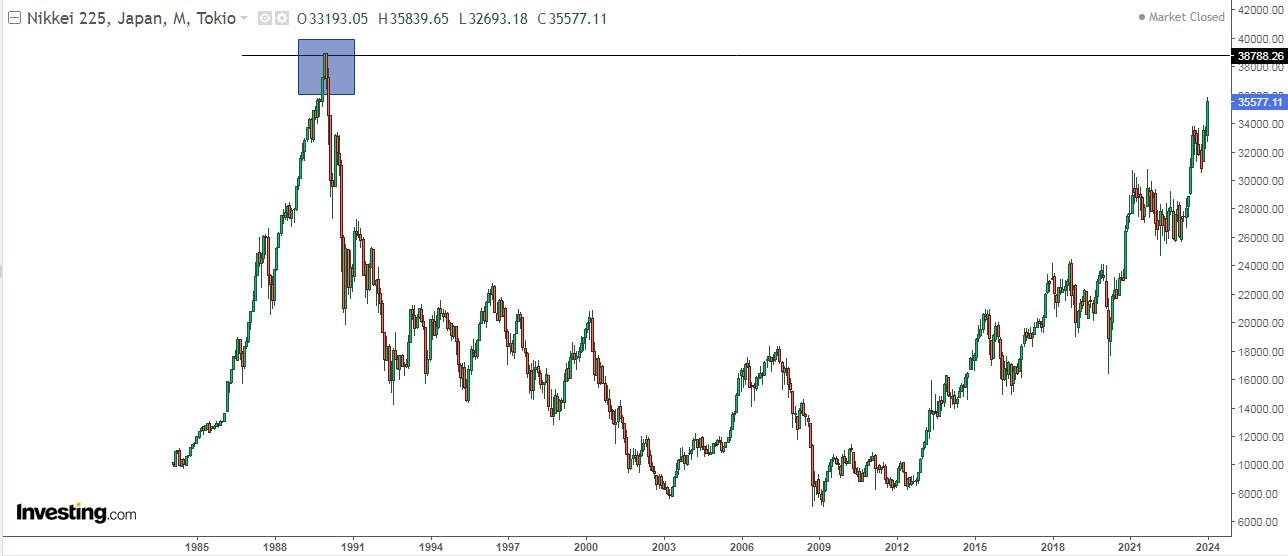
- Meanwhile, the Japanese stock market, particularly the Nikkei 225, has shown remarkable strength this year so far.
- Looking to beat the market in 2024? Let our AI-powered ProPicks do the leg work for you, and never miss another bull market again. Learn More »
- The Dow Jones, on average, falls by -0.31% the day after MLK.
- The S&P 500 experienced an average decline of -0.25% on the day after.
- The Nasdaq records an average drop of -0.22%.
- The Russell 2000 shows a decline of -0.34%.
- Year 2013: 52
- Year 2014: 38
- Year 2015: 6
- Year 2016: 26
- Year 2017: 71
- Year 2018: 15
- Year 2019: 23
- Year 2020: 14
- Year 2021: 45
- Year 2022: 2
- Year 2023: 7
- Year 2024: 1
- Verve Therapeutics Inc (NASDAQ:VERV)
- 2U Inc (NASDAQ:TWOU)
- Intellia Therapeutics Inc (NASDAQ:NTLA)
- InVitae Corp (NYSE:NVTA)
- Ginkgo Bioworks Holdings (NYSE:DNA)
- A slowdown in electric cars is expected.
- Government incentives are coming to an end.
- The cheaper models of its Chinese rival BYD (SZ:002594) pose a threat in the form of competition and will try to snatch the number one position as the leader in the sector.
- Japanese Nikkei +6.31%.
- FTSE MIB Italian +0.39%
- S&P 500 +0,29%
- Ibex 35 Spanish -0.07
- Dow Jones -0.26%
- Nasdaq -0,26%
- Dax alemán -0,28%
- Euro Stoxx 50 -0,92%
- Cac francés -1,03%
- FTSE 100 UK -1.40%
Yesterday marked Martin Luther King Day, a federal holiday since 1983. Historically, the market has exhibited a positive average reaction on the Friday before and a weaker performance on the following Tuesday. Here are the figures:
As of this writing, futures are deep into red territory, so it appears as though history should prevail on this one again today.
Moreover on the history rimes front, despite the sluggish start to the year, signals still look positive for the Dow.
In 2023, the the industrial index narrowly preserved an impressive streak, managing to set at least one new all-time high each year for several consecutive years.

In 2023, with the achievement of setting all-time highs and an additional occurrence in early 2024, the Dow Jones has now extended its streak to an impressive 12 consecutive years, matching the previous record from 1989 to 2000.
It's noteworthy that considering the period from 1900 to 2024, the Dow Jones experienced years of fluctuation. Over this span, there were 56 years in which it reached at least one all-time high and 69 years in which it did not.
The most prolonged stretch without any all-time high occurred from 1930 to 1953.
5 Cathie Wood Stocks That Wall Street Is in Love With
Despite the positive winds for the Dow, it's another type of stock that's been leading the bunch: high-flying tech.
In fact, after a deep sell-off in 2022, Wall Street has been excited about a several stocks held by Cathie Wood in her ARK Innovation ETF (NYSE:ARKK), which ended 2023 with a return of +67%, beating the QQQ (+54%) and the S&P 500 (+24.23%).
Main stocks in her ETF:
It's worth noting that Cathie Wood has resumed buying shares of Tesla (NASDAQ:TSLA) in 2024. This follows a pattern where she sold Tesla shares in multiple phases over three consecutive quarters throughout 2023.
Intriguingly, she divested during a period of robust stock ascent and is now reacquiring them at a time when Wall Street is showing increasing skepticism towards the company for various reasons:
Specifically, she acquired 216,000 shares between December 20 and January 3.
Crude Oil: Biggest Threat to Inflation
Oil prices surged (reaching above $80) after a U.S.-led coalition launched strikes against Houthi rebel targets in Yemen.
While the strikes were aimed at reducing the threat to international shipping, they could escalate the conflict in the Middle East.
The main upside risk to prices relates to Iran and whether it becomes directly involved in the conflict, which could threaten oil supplies in a region that produces a third of the world's crude.
The instability in the Red Sea could restrict for months a key route for exchanges between Asia and Europe, through which the passage of container ships, forced to make longer and more costly journeys, has already been reduced by 90%.
In fact, the average price of shipping a container has soared this week by +85% more than in the second half of December.
This could be a major setback for the world economy since 5% of international trade passes through this route, so many products will be particularly expensive and it would not exactly help inflation to fall.
The Rise of the Japanese Stock Market
The Nikkei 225 index crossed the 35,000 mark for the first time in almost 34 years and over the past 52 weeks, it has risen +36.7%, ending the week up over +6% and surprising everyone except Warren Buffett, who started buying in Japan in 2020.
Meanwhile, the index Topix, which has a broader range of companies, rose for the seventh straight session.

Strength in Japan has pushed both indexes to 34-year highs amid inflows from foreign investors, a favorable exchange rate, and investor optimism that a decades-long deflation is nearing an end.
In addition, Chinese investors are flocking to Japanese exchange-traded funds.
Ranking of the stock markets in 2024
Here is the ranking of the main European and US stock exchanges so far in 2024:
Investor sentiment (AAII)
Bullish sentiment, i.e. expectations that stock prices will rise over the next six months, stands at 48.6% and is above its historical average of 37.5%.
Bearish sentiment, i.e. expectations that stock prices will fall over the next six months, is at 24.2%, below its historical average of 31%.
***
In 2024, let hard decisions become easy with our AI-powered stock-picking tool.
Have you ever found yourself faced with the question: which stock should I buy next?
Luckily, this feeling is long gone for ProPicks users. Using state-of-the-art AI technology, ProPicks provides six market-beating stock-picking strategies, including the flagship "Tech Titans," which outperformed the market by 670% over the last decade.
________________________________________________________
Want to start using InvestingPro? Here is a small gift from us! Enjoy an extra 10% discount on the 1 or 2 year plans. Hurry up not to miss the New Year’s sale! You can save almost 60%!
Follow this link for the 1-year plan with your personal discount,
or click here for the full 2-year plan with 60% off!
Disclaimer: This article is written for informational purposes only; it does not constitute a solicitation, offer, advice, or recommendation to invest as such it is not intended to incentivize the purchase of assets in any way. I would like to remind you that any type of asset, is evaluated from multiple points of view and is highly risky and therefore, any investment decision and the associated risk remains with the investor.
