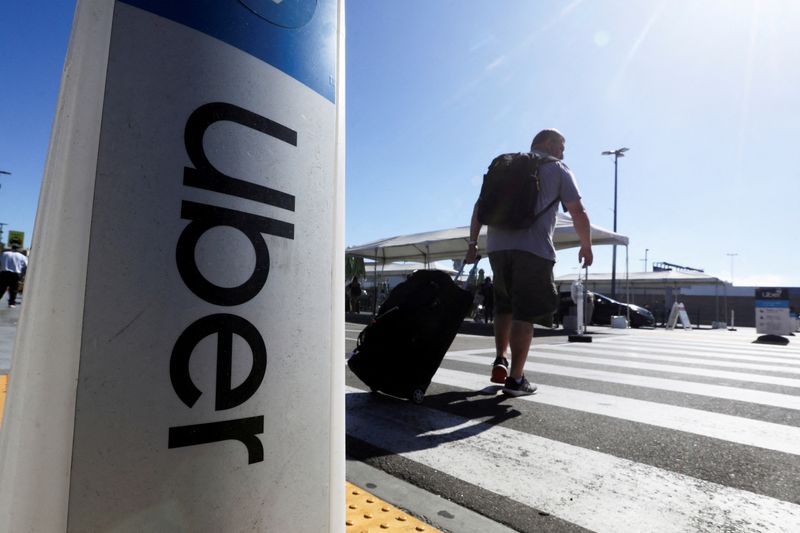


Ride-Share Revolution | Uber's strategic moves in autonomous vehicles and global expansion reshape the transportation landscape, positioning the company for future growth |
Financial Acceleration | Explore Uber's robust financial performance, with revenue projected to reach $58.89 billion by FY26 and adjusted EBITDA growth to $10.78 billion |
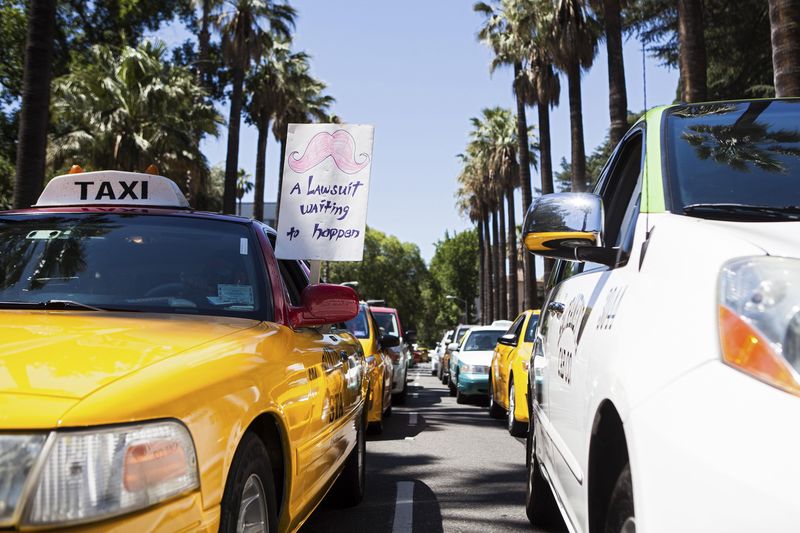
Competitive Crossroads | Delve into Uber's market leadership challenges as AV competitors and regulatory hurdles threaten its dominant position in ride-sharing |
Analyst Outlook | Discover varied analyst perspectives, with price targets ranging from $85 to $115, reflecting Uber's complex business environment and growth potential |
Metrics to compare | UBER | Sector Sector - Average of metrics from a broad group of related Technology sector companies | Relationship RelationshipUBERPeersSector | |
|---|---|---|---|---|
P/E Ratio | 15.7x | 30.3x | 12.4x | |
PEG Ratio | −0.55 | 0.31 | 0.03 | |
Price/Book | 5.4x | 2.7x | 1.4x | |
Price / LTM Sales | 2.5x | 1.1x | 1.2x | |
Upside (Analyst Target) | 60.6% | 19.3% | 28.6% | |
Fair Value Upside | Unlock | 7.3% | 8.7% | Unlock |
Uber Technologies, Inc. develops and operates proprietary technology applications in the United States, Canada, Latin America, Europe, the Middle East, Africa, and the Asia Pacific. The company operates through three segments: Mobility, Delivery, and Freight. The Mobility segment connects consumers with a range of transportation modalities, such as ridesharing, carsharing, micromobility, rentals, public transit, taxis, and other modalities; and offers riders in a variety of vehicle types, as well as financial partnerships products and advertising services. The Delivery segment allows consumers to search for and discover restaurants to grocery, alcohol, convenience, and other retailers, as well as order a meal or other items, and either pick-up at the restaurant or have it delivered; and provides Uber direct, a white-label delivery-as-a-service for retailers and restaurants, as well as advertising services. The Freight segment manages transportation and logistics networks, which connects shippers and carriers in digital marketplace, including carriers upfronts, pricing, and shipment booking; and offers on-demand platform to automate logistics end-to-end transactions for small-and medium-sized businesses to global enterprises. Uber Technologies, Inc. has staetegic partnership with Mews to embed ride booking, real-time tracking and integrated billing directly into the Mews platform. The company was formerly known as Ubercab, Inc. and changed its name to Uber Technologies, Inc. in February 2011. Uber Technologies, Inc. was founded in 2009 and is headquartered in San Francisco, California.