Metrics to compare | TFGJ | Sector Sector - Average of metrics from a broad group of related Consumer Cyclicals sector companies | Relationship RelationshipTFGJPeersSector | |
|---|---|---|---|---|
P/E Ratio | 12.8x | 11.7x | 10.4x | |
PEG Ratio | −0.22 | 0.21 | 0.02 | |
Price/Book | 0.7x | 1.8x | 1.4x | |
Price / LTM Sales | 0.3x | 0.6x | 0.9x | |
Upside (Analyst Target) | 28.3% | 33.5% | 28.5% | |
Fair Value Upside | Unlock | 33.4% | 12.8% | Unlock |
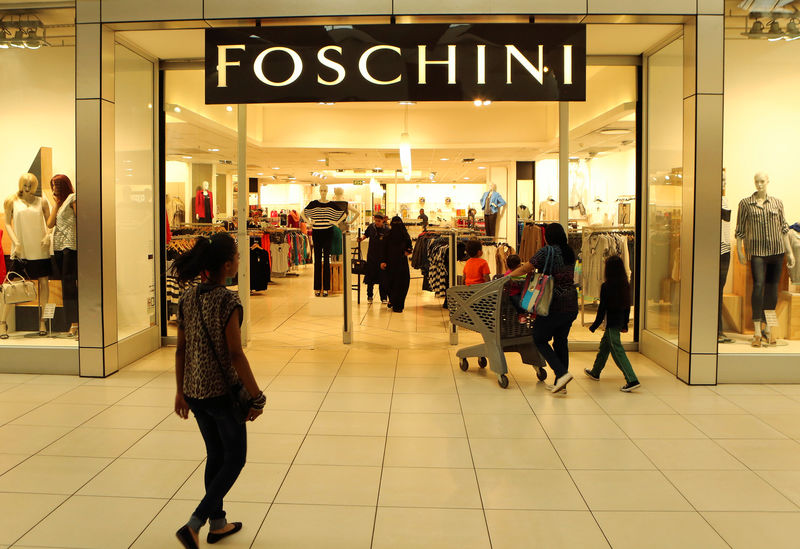
The Foschini Group Limited, together with its subsidiaries, operates retail stores in South Africa and internationally. The company operates through TFG Africa, TFG London, and TFG Australia segments. It provides clothing, leisurewear, accessories, lingerie, footwear, cosmetics, fine jewellery, furniture, Homeware and furniture, sporting apparel, and kidswear. The company offers its products under the Home, American Swiss, Homelivingspace, Archive, BeautyBox, Bash, The Bed Store, Connor, Coricraft, Dial-a-Bed, Exact, Fabiani, The FIX, Foschini, Galaxy & Co., Granny Goose, G-Star RAW, Hi, JD, Hobbs, Jet, Jet Home, Johnny Bigg, Markham, Phase Eight, White Stuff, Relay Jeans, RFO, Rockwear, Sneaker Factory, Sportscene, Inside Story, Sterns, Tarocash, Totalsports, Volpes, Whistles, and Yd brand names. It serves its products online. The company was formerly known as Foschini Limited and changed its name to The Foschini Group Limited in September 2010. The Foschini Group Limited was founded in 1924 and is headquartered in Cape Town, South Africa.