Rasan Information Technology (8313)

Currency in SAR
155.90
+0.10(+0.06%)
Closed·
Trading near 52-week High
8313 is not included in our AI-picked strategies. See which stocks are.
Fair Value
Day's Range
155.40159.00
52 wk Range
74.10159.00
Key Statistics
Bid/Ask
155.90 / 156.20
Prev. Close
155.8
Open
158.8
Day's Range
155.4-159
52 wk Range
74.1-159
Volume
115.72K
Average Volume (3m)
366.05K
1-Year Change
93.9055%
Fair Value
unlockUnlock
Fair Value Upside
unlockUnlock
8313 Scorecardpro icon
Company’s Health
Unlock
Fair Value
Unlock Price
Fair Price
Upside
Price Target
159.94
Upside
+2.59%
Members' Sentiments
Bearish
Bullish
ProTips
Trading at a low P/E ratio relative to near-term earnings growth
Show more

Technical Analysis

Summary
Strong Sell
Sell
Neutral
Buy
Strong Buy
Sell
Technical Indicators
Strong Sell
Moving Averages
Neutral

Analyst Ratings

4 Buy
1 Hold
0 Sell
Ratings:
5 analysts
Overall Consensus
Buy

Analysts 12-Month Price Target:

Average 159.94
(+2.59% Upside)
Firm
ArticlePositionPrice TargetUpside / DownsideFrom Price TargetActionDate

Earnings

Latest Release
04/05/2026
EPS / Forecast
1.14 / --
Revenue / Forecast
261M / --
EPS Revisions
Last 90 days

Compare 8313 to Peers and Sector

Metrics to compare
8313
Peers
Sector
Relationship
P/E Ratio
39.6x21.2x9.8x
PEG Ratio
0.240.030.03
Price/Book
14.7x1.4x1.0x
Price / LTM Sales
15.2x1.4x2.8x
Upside (Analyst Target)
2.7%74.4%17.7%
Fair Value Upside
Unlock24.4%2.7%Unlock

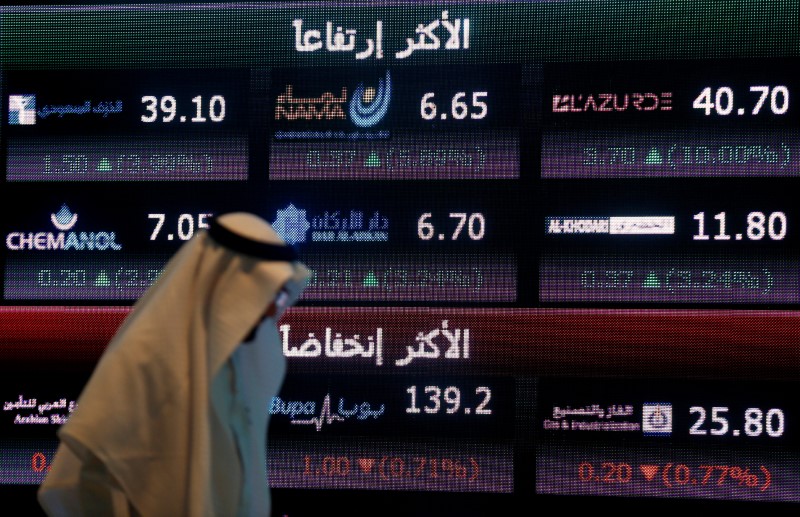
Rasan Information Technology Company, a financial technology company, provides insurance and financial services in the Kingdom of Saudi Arabia. The company operates Tameeni, an online insurance aggregator; Treza, a technology enabler for banks, insurance companies, and intermediaries; Awal Mazad, an online auto auction platform; R2, a data analytics solution designed for insurance companies to enhance and streamline portfolio performance monitoring, pricing, reserving, and other activities; and R3, a data-driven tool designed for deep portfolio insights, real-time market intelligence, and decision-making for motor leasing companies. It also engages in computer systems and communication equipment software design; analysis and design of programs, databases, applications, and related services; vehicle auction, towing, and storage; electronic publishing; online wholesale; design and customization of program software, interface design, and user experience and application development; and digital finance brokerage activities. In addition, the company is involved in software maintenance and web page design, setting up web page hosting infrastructure, electronic insurance brokerage, online auto auction and leasing insurance, and SMS and website design. Rasan Information Technology Company was incorporated in 2016 and is based in Riyadh, Saudi Arabia.

Ownership

Ownership Overview

Type
Common Stock Held% of Shares OutstandingMarket Value
Mutual Funds & ETFs
7.96M10.26%1.24B
Other Institutional Investors
13.50M17.41%2.10B
Public Companies & Retail Investors
56.05M72.32%8.73B
Total
77.51M100.00%12.08B

Top Holders

Holder
% of holding
Shares Held
Date Reported
Value (In 1,000s)
Impact Funds for Financial Technology Company12.77%9,895,3191,541,691
Assets Custody Development Impact Company for Communications and Information Technology4.39%3,401,146529,899

People Also Watch

53.80
4264
+4.57%
27.40
8200
+2.78%
139.70
4165
-0.64%

FAQ

What Is the Rasan Information Tech (Saudi Arabia: 8313) Share Price Today?

The Rasan Information Tech stock price today is 155.90 SAR.

What Stock Exchange Does Rasan Information Tech (8313) Trade On?

Rasan Information Tech is listed and trades on the Saudi Arabia Stock Exchange.

What Is the Ticker (Stock Symbol) for Rasan Information Tech?

The stock symbol (also called a 'ticker') for Rasan Information Tech is "8313."

What Is the Current Rasan Information Tech Market Capitalisation?

As of today, Rasan Information Tech (Saudi Arabia: 8313) market cap is 12.08B SAR.

What Is Rasan Information Tech's (8313) Earnings Per Share (TTM)?

The Rasan Information Tech EPS is currently 4.04 (Trailing Twelve Months).

When Is the Next Rasan Information Tech Earnings Date?

Rasan Information Tech's next earnings report will be released on 04/08/2026.

Is 8313 a Buy or Sell From a Technical Analyst Perspective?

Based on today's Rasan Information Tech moving averages and other technical indicators, the daily buy/sell signal for 8313 stock is Strong Buy.

How Many Times Has Rasan Information Tech Stock Split?

Rasan Information Tech has split 0 times. (See the 8313 stock split history page for full effective split date and price information.)

What is the current trading status of Rasan Information Tech (Saudi Arabia: 8313)?

As of 14/06/2026, Rasan Information Tech (8313) is trading at a share price of 155.90 SAR, with a previous close of 155.80 SAR. The stock has fluctuated within a day range of 155.40 SAR to 159.00 SAR, while its 52-week range spans from 74.10 SAR to 159.00 SAR.

What Is Rasan Information Tech (8313) Price Target According to Analysts?

The average 12-month price target for Rasan Information Tech is 159.94 SAR, with a high estimate of 180 SAR and a low estimate of 134.7 SAR. 4 analysts recommend buying the stock, while 0 suggest selling, leading to an overall rating of Buy. The stock has an +2.59% Upside potential.
Risk Disclosure: Trading in financial instruments and/or cryptocurrencies involves high risks including the risk of losing some, or all, of your investment amount, and may not be suitable for all investors. Prices of cryptocurrencies are extremely volatile and may be affected by external factors such as financial, regulatory or political events. Trading on margin increases the financial risks.
Before deciding to trade in financial instrument or cryptocurrencies you should be fully informed of the risks and costs associated with trading the financial markets, carefully consider your investment objectives, level of experience, and risk appetite, and seek professional advice where needed.
Fusion Media would like to remind you that the data contained in this website is not necessarily real-time nor accurate. The data and prices on the website are not necessarily provided by any market or exchange, but may be provided by market makers, and so prices may not be accurate and may differ from the actual price at any given market, meaning prices are indicative and not appropriate for trading purposes. Fusion Media and any provider of the data contained in this website will not accept liability for any loss or damage as a result of your trading, or your reliance on the information contained within this website.
It is prohibited to use, store, reproduce, display, modify, transmit or distribute the data contained in this website without the explicit prior written permission of Fusion Media and/or the data provider. All intellectual property rights are reserved by the providers and/or the exchange providing the data contained in this website.
Fusion Media may be compensated by the advertisers that appear on the website, based on your interaction with the advertisements or advertisers.
© 2007-2026 - Fusion Media Limited. All Rights Reserved.