El Al (ELAL)

Currency in ILS
1,332.0
+54.0(+4.23%)
Closed·
High dividend Yield
ELAL is not included in our AI-picked strategies. See which stocks are.
Fair Value
Day's Range
1,309.01,378.0
52 wk Range
1,134.01,866.0
Key Statistics
Bid/Ask
1,332.00 / 830.70
Prev. Close
1,278
Open
1,309
Day's Range
1,309-1,378
52 wk Range
1,134-1,866
Volume
2.44M
Average Volume (3m)
2.16M
1-Year Change
-3.9654%
Fair Value
unlockUnlock
Fair Value Upside
unlockUnlock
ELAL Scorecardpro icon
Company’s Health
Unlock
Fair Value
Unlock Price
Fair Price
Upside
Analysts Sentiment
Currently not supported.
Members' Sentiments
Bearish
Bullish
ProTips
High shareholder yield

El Al News & Analysis

Show more

Technical Analysis

Summary
Strong Sell
Sell
Neutral
Buy
Strong Buy
Strong Buy
Technical Indicators
Strong Buy
Moving Averages
Buy
Firm
ArticlePositionPrice TargetUpside / DownsideFrom Price TargetActionDate

Earnings

Latest Release
20/05/2026
EPS / Forecast
-0.12 / --
Revenue / Forecast
562.4M / --
EPS Revisions
Last 90 days

Dividends

Payout Ratio
Payout ratio (TTM)
Earnings retained
EPS 0.42%
Dividend Yield
4.46%
Industry Median 4.21%
Annualised payout
57.00
Paid annually
5-Years Growth
-
Growth Streak

El Al (ELAL) Income Statement & Profits

Compare ELAL to Peers and Sector

Metrics to compare
ELAL
Peers
Sector
Relationship
P/E Ratio
11.1x5.2x12.2x
PEG Ratio
−0.180.000.03
Price/Book
2.7x0.9x1.4x
Price / LTM Sales
0.8x0.4x1.3x
Upside (Analyst Target)
-43.7%24.5%
Fair Value Upside
Unlock14.1%7.7%Unlock

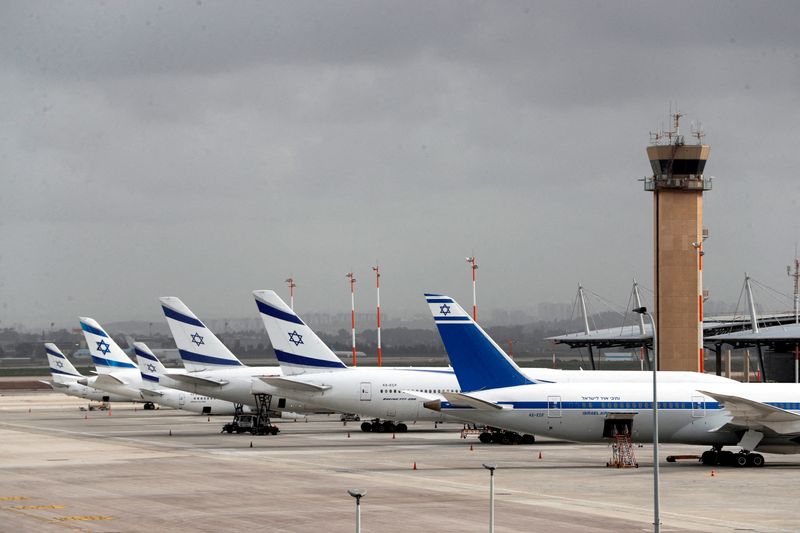
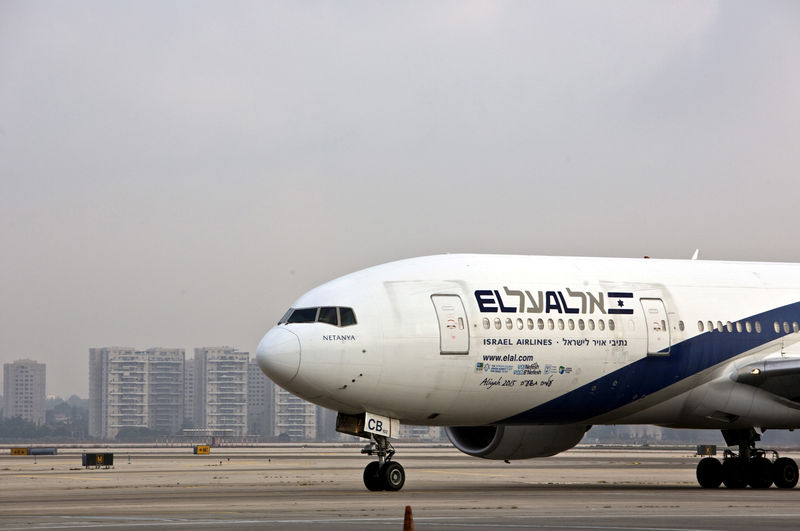
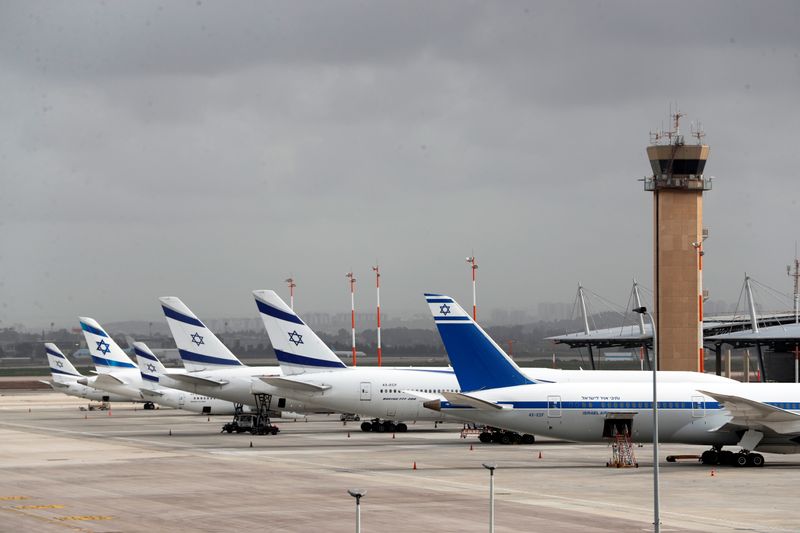
El Al Israel Airlines Ltd., together with its subsidiaries, provides passenger and cargo transportation services. It operates flights on passenger and cargo in countries in Europe, the United States, Asia, and Africa. The company offers aircraft maintenance services; sells duty-free products; produces and supplies food to airlines; security services to aviation; and operates a loyalty program. It also produces and supplies prepared kosher meals to airlines, cruise companies, and institutions. In addition, the company markets vacation packages. The company was incorporated in 1948 and is headquartered in Lod, Israel.

Ownership

Ownership Overview

Type
Common Stock Held% of Shares OutstandingMarket Value
Mutual Funds & ETFs
68.67M11.63%914.72M
Other Institutional Investors
35.21M5.96%469.02M
Public Companies & Retail Investors
486.59M82.41%6.48B
Total
590.47M100.00%7.87B

Top Holders

Holder
% of holding
Shares Held
Date Reported
Value (In 1,000s)
Harel Insurance Investments & Financial Services Ltd4.85%28,614,531381,146
Phoenix Investments & Finances Ltd1.52%8,996,356119,831

People Also Watch

7,069
POLI
+2.04%
30,460
NXSN
+6.28%
84,250
DLEKG
-1.01%
76,440
TSEM
+3.62%
25,230
NICE
-1.68%

FAQ

What Is the El Al (Tel Aviv: ELAL) Share Price Today?

The El Al stock price today is 1,332.0 ILS.

What Stock Exchange Does El Al (ELAL) Trade On?

El Al is listed and trades on the Tel Aviv Stock Exchange.

What Is the Ticker (Stock Symbol) for El Al?

The stock symbol (also called a 'ticker') for El Al is "ELAL."

Does El Al Pay Dividends? What’s The Current ELAL Dividend Yield?

Yes, ELAL Pays Dividends to its Shareholders. The current El Al dividend yield is 4.46%.

What Is the Current El Al Market Capitalisation?

As of today, El Al (Tel Aviv: ELAL) market cap is 7.87B ILS.

What Is El Al's (ELAL) Earnings Per Share (TTM)?

The El Al EPS is currently 0.4 (Trailing Twelve Months).

Is ELAL a Buy or Sell From a Technical Analyst Perspective?

Based on today's El Al moving averages and other technical indicators, the daily buy/sell signal for ELAL stock is Neutral.

How Many Times Has El Al Stock Split?

El Al has split 2 times. (See the ELAL stock split history page for full effective split date and price information.)

How Many Employees Does El Al Have?

El Al has 3169 employees, based on their latest Companies House report.

What is the current trading status of El Al (Tel Aviv: ELAL)?

As of 15/06/2026, El Al (ELAL) is trading at a share price of 1,332.0 ILS, with a previous close of 1,278.0 ILS. The stock has fluctuated within a day range of 1,309.0 ILS to 1,378.0 ILS, while its 52-week range spans from 1,134.0 ILS to 1,866.0 ILS.
Risk Disclosure: Trading in financial instruments and/or cryptocurrencies involves high risks including the risk of losing some, or all, of your investment amount, and may not be suitable for all investors. Prices of cryptocurrencies are extremely volatile and may be affected by external factors such as financial, regulatory or political events. Trading on margin increases the financial risks.
Before deciding to trade in financial instrument or cryptocurrencies you should be fully informed of the risks and costs associated with trading the financial markets, carefully consider your investment objectives, level of experience, and risk appetite, and seek professional advice where needed.
Fusion Media would like to remind you that the data contained in this website is not necessarily real-time nor accurate. The data and prices on the website are not necessarily provided by any market or exchange, but may be provided by market makers, and so prices may not be accurate and may differ from the actual price at any given market, meaning prices are indicative and not appropriate for trading purposes. Fusion Media and any provider of the data contained in this website will not accept liability for any loss or damage as a result of your trading, or your reliance on the information contained within this website.
It is prohibited to use, store, reproduce, display, modify, transmit or distribute the data contained in this website without the explicit prior written permission of Fusion Media and/or the data provider. All intellectual property rights are reserved by the providers and/or the exchange providing the data contained in this website.
Fusion Media may be compensated by the advertisers that appear on the website, based on your interaction with the advertisements or advertisers.
© 2007-2026 - Fusion Media Limited. All Rights Reserved.