
- All Instrument Types
- Indices
- Equities
- ETFs
- Funds
- Commodities
- Currencies
- Crypto
- Bonds
- Certificates
Please try another search

Opening Bell: U.S. Futures Stage Solid Rebound As U.S. Trade Talk Turns Positive

- U.S. futures turn early losses into solid gains on reports U.S.-China phase-one deal may still come before next tariff round
- European shares rally, unaffected by U.S.-China tensions over human rights violation
- Yields also reverse higher, after tumbling the most since August
- WTI surges ahead of OPEC+ meeting
Key Events
Futures on the S&P 500, Dow and NASDAQ 100 staged a swift reversal this morning, charging higher after hints U.S. negotiators still expected to reach a phase-one deal with China before the next round of tariffs scheduled for Dec. 15.
The unconfirmed reports appeared to be a damage-control move after U.S. President Donald Trump's remarks that a trade deal may not come before the November 2020 presidential elections had sparked widespread selloffs, alongside the latest tariffs threats on South American and European countries.
The selling had resumed earlier on Wednesday after China warned of retaliation "in proportion"—including visa restrictions on U.S. officials—to a bill passed by the U.S. lower house sanctioning a member of the Chinese government for the detention of Muslims in the Xinjiang region.
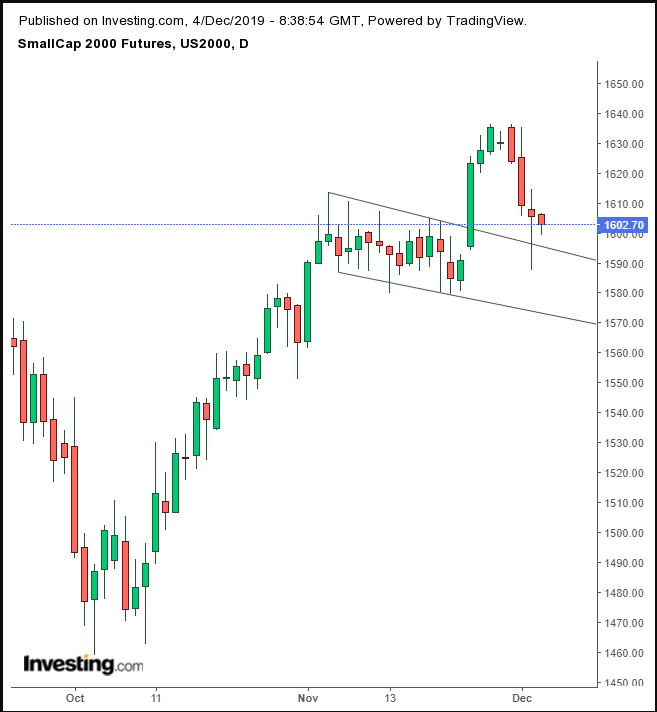
Even before U.S. contracts reversed their initial slide, Russell 2000 futures remained well above a bullish flag.
Europe's STOXX 600 also surged, ending a four-day selloff.
Global Financial Affairs
In the earlier Asian session, regional indices closed in the red. Australia’s S&P/ASX 200 (-1.58%) underperformed for the second day due to its dependence on China’s trade stability, while China’s Shanghai Composite managed to contain losses to 0.23% despite Trump's remarks on Monday, downplaying the urgency of a trade deal.
It's noteworthy that U.S. equities took a much harsher hit from Monday's news than Chinese shares: the Dow Jones Industrial Average tumbled -1.01%, while China’s A50 (-0.05%) held steady.
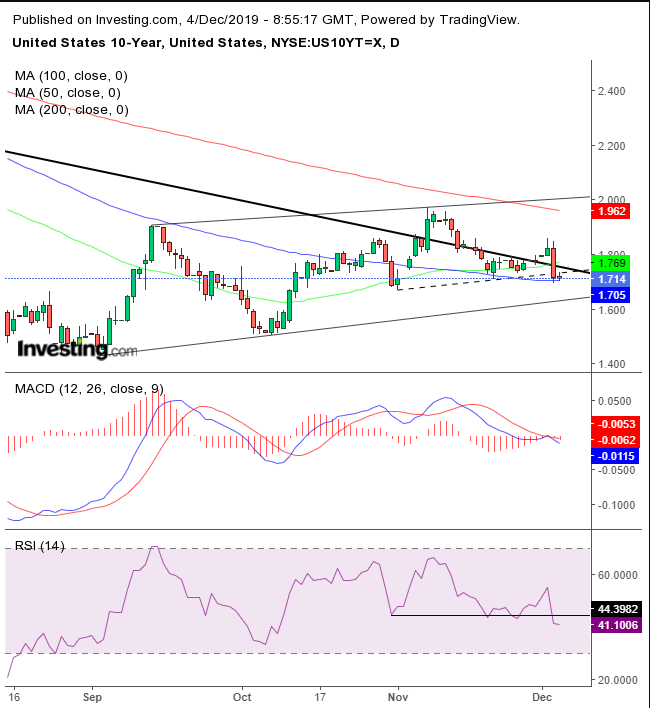
In the bond market, the yield on 10-year Treasurys also reversed its course, edging higher after slipping back below its long-term downtrend line since the August 2018 top, after investors' rush to safety on Monday prompted rates to fall the hardest since August.
Yields found support above the 100 DMA, but only after falling below the 50 MA and the short-term uptrend line since Nov. 1. They remain within a rising channel since the Sept. 3 bottom—however, both the MACD and the RSI provide bearish indications.
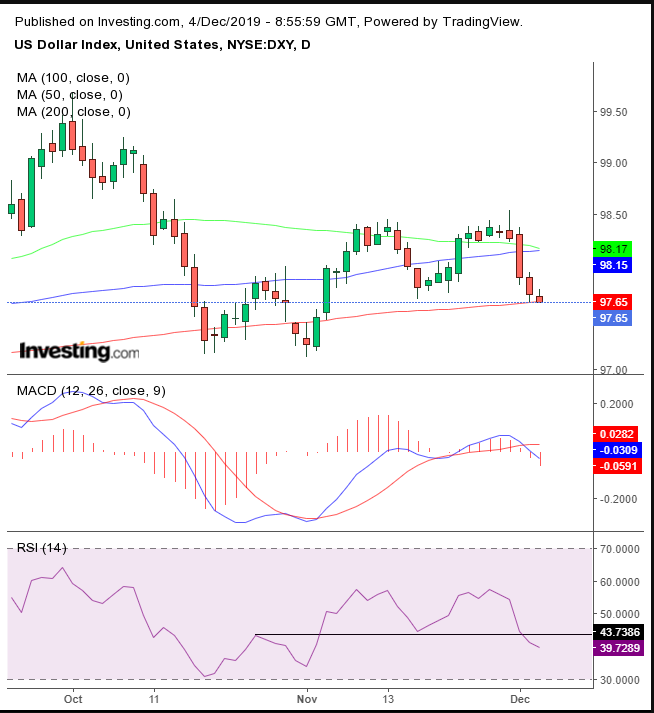
The dollar was pushing against the topside of the 200 DMA, after both the MACD and the RSI turned sour.
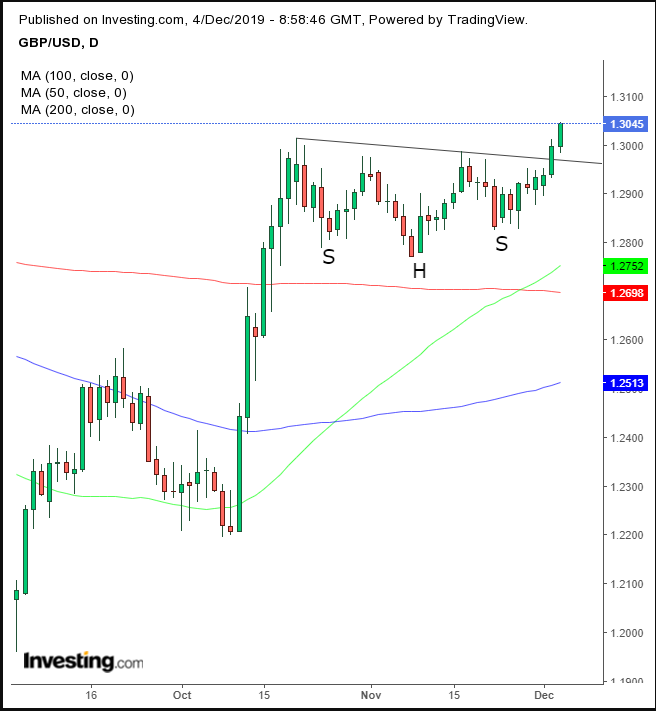
The British pound climbed near a seven-month high as polls showed the Conservative party in the lead ahead of next week's general elections. Technically, cable completed a H&S continuation pattern concurrent with a golden cross.
The yen extended its gains against the dollar. Technically, the currency fell below the uptrend line since the August bottom, after falling below the 200 DMA.
The Australian dollar dropped alongside domestic bond yields after disappointing growth data fueled bets for more policy easing next year.
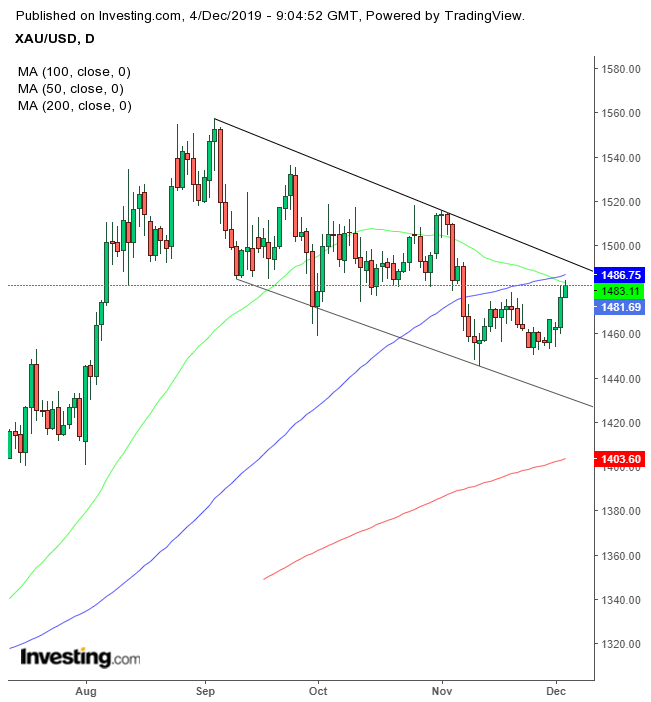
Gold advanced toward a one-month high, rising for the third day out of four—stopping below the 50 DMA, the 100 DMA and the top of a falling channel since Sept. 3. In the later European morning, the yellow metal slipped below neutral levels as risk off gave way to new-found optimism.
Crude oil also climbed as traders focused on the upcoming OPEC+ meeting, which could lead to deeper supply cuts by some of the world's biggest oil producers.
UP Ahead
Market Moves
Stocks
Currencies
Bonds
Commodities
Related Articles

UK markets were off to a brisk start amid the technological navel gazing elsewhere. The medical sector received another shot in the arm following strong numbers from FTSE100...

The stock market sold off on a decline in February's Consumer Confidence Index (CCI), confirming a similar decline in February's Consumer Sentiment Index (CSI), which was reported...

The UK’s inflation rate has shown a slight dip in the latest figures released today, signaling a small but meaningful shift in the country’s ongoing battle with rising prices....
Are you sure you want to block %USER_NAME%?
By doing so, you and %USER_NAME% will not be able to see any of each other's Investing.com's posts.
%USER_NAME% was successfully added to your Block List
Since you’ve just unblocked this person, you must wait 48 hours before renewing the block.
I feel that this comment is:
Thank You!
Your report has been sent to our moderators for review



Add a Comment
We encourage you to use comments to engage with users, share your perspective and ask questions of authors and each other. However, in order to maintain the high level of discourse we’ve all come to value and expect, please keep the following criteria in mind:
Perpetrators of spam or abuse will be deleted from the site and prohibited from future registration at Investing.com’s discretion.