- U.S. futures climb, European shares brush off dismal German data
Key Events
Futures on the S&P 500, Dow and NASDAQ 100 gained ground this morning, while Europe's STOXX 600 found some solid footing even after dismal German industrial output further darkened the economic outlook for the continent. Strong appetite for Treasurys and gold, however, continued to signal investor wariness around global trade and growth headwinds.
From a technical perspective, the pan-European benchmark rebounded after yesterday’s inverted hammer above the support of the late June low.
However, the index would have to contend with the selling pressure that was presumably triggered after it closed below the 200 DMA for the first time since Sep. 27, 2018—when the price proceeded to drop 14% till the Dec. 2018 bottom. If the price declines below the June low, it would complete a double top since mid-February.

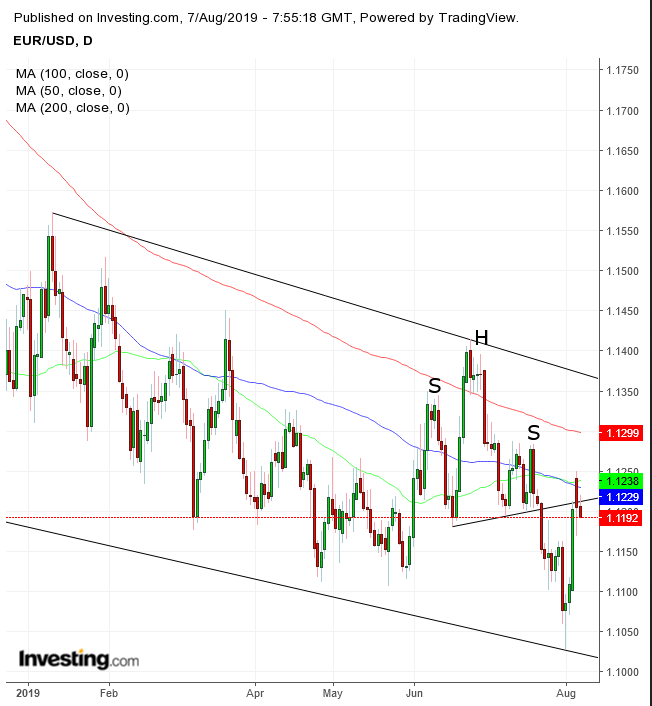
Perhaps a weakening euro—which took a beating from German factory activity tumbling 1.5% month-on-month, far below the expected 0.5% decline—boosted stocks, partly offsetting recession fears. As we've often pointed out, in the post QE environment, investors are ultimately more concerned with cheap money than the integrity of the economic pattern.
From a technical standpoint, the single currency retested the neckline of a H&S continuation pattern on Tuesday, confirming its resistance with a close beneath it, and today it extended the selloff. The pattern emerged within a descending channel since Nov. 2018.
In the earlier Asian session, regional equities extended a selloff as the People's Bank of China set the daily currency fixing for the yuan at below the key 7,000 level, which it had restored a day earlier amid heightened trade tensions and a global equity tumble.
South Korea’s KOSPI (-0.41%) underperformed, hitting the lowest price since February 2016, after completing a H&S continuation pattern.
Japan’s Nikkei 225 (-0.33%) slipped lower after testing the neckline of a H&S continuation pattern since February. The 100 DMA is about to cross below a falling 200 DMA, after the 50 DMA has already done so in May.
China’s Shanghai Composite (-0.32%) followed right behind, extending a drop after falling with a downside gap below the 200 DMA, completing a peak-trough downward reversal.
Hong Kong’s Hang Seng (+0.08%) enjoyed a respite after a five-day selloff, even as civil unrest continued.
Australia’s S&P/ASX 200 (+0.64%) outperformed thanks to a fifth day rally in gold-related shares. Domestic shares also enjoyed the cheapest currency since early 2009, after policymakers from neighboring country New Zealand cut interest rates more than expected, dragging the Aussie dollar lower. Technically speaking, the equity benchmark is the last major regional index to remain in an uptrend, though the gauge has fallen below its uptrend line since the December bottom, questioning the rising trend’s integrity.
Global Financial Affairs
Yesterday, U.S. shares rebounded, with the S&P 500 climbing back 1.30%, after six days of losses. A bleak trade outlook posted by Citigroup’s analysts took some of the wind out of the rally, as they warned the U.S.-China spat will protract long enough to hit U.S. companies' earnings.

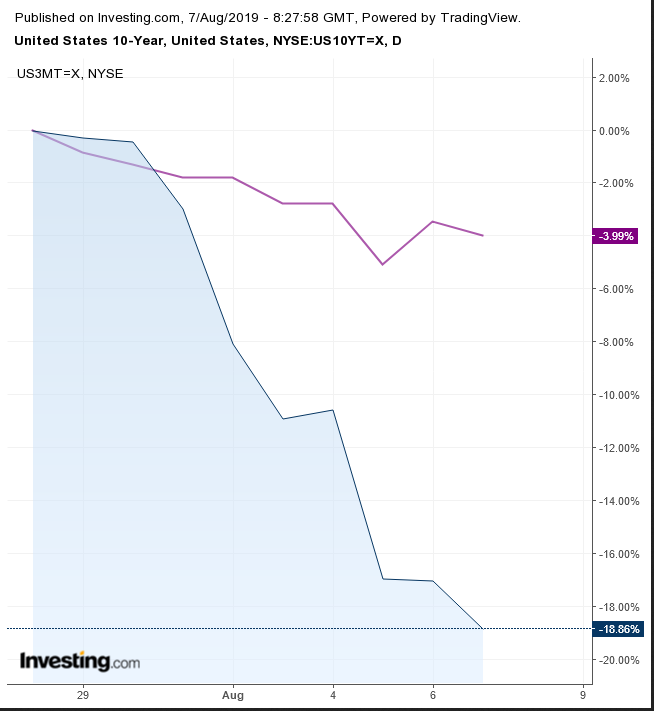
On Wednesday, investors kept seeking safety in government bonds despite a more upbeat stock environment, pushing yields on 10-year notes down again, to wipe out most of yesterday’s gains and extend the most extreme yield-curve inversion since the lead-up to the 2008 financial crisis.

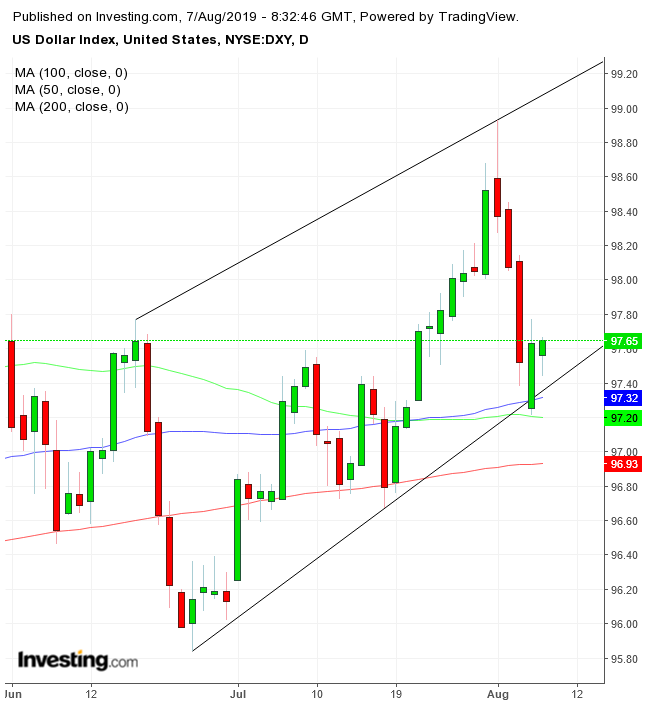
After an early slide, the dollar reclaimed yesterday’s levels, reconfirming support at the bottom of a rising channel, guarded by the 50 and 100 DMAs.

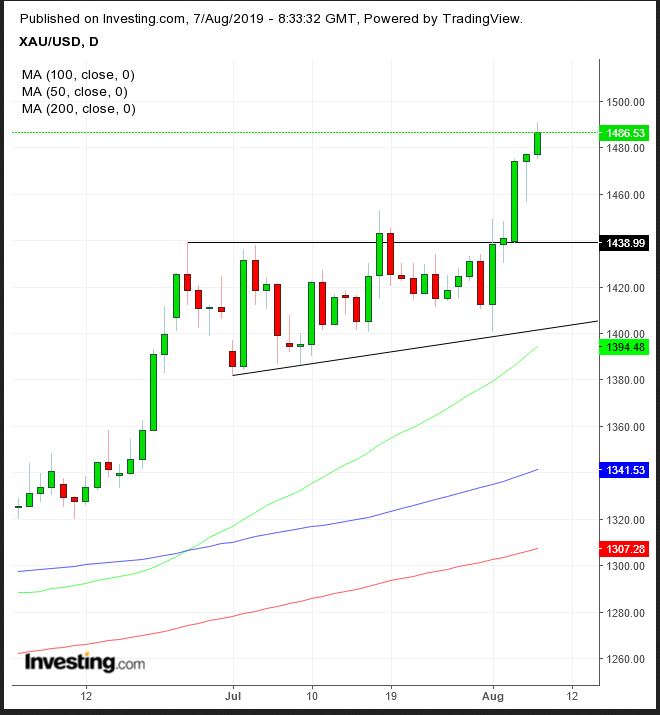
Gold advanced for the fifth day to near a six-year high, confirming persisting market fears.
Oil prices rebounded from a dip but lingered in the red.
Market Moves
Stocks
- The MSCI All-Country World Index advanced 0.1%.
- The U.K.’s FTSE 100 was little changed.
Currencies
- The Dollar Index was little changed.
- The euro was little changed at $1.1201.
- The British pound was little changed at $1.2177.
- The Japanese yen increased 0.2% to 106.25 per dollar.
Bonds
- The yield on 10-year Treasurys decreased two basis points to 1.69%, hitting the lowest in almost three years with its ninth straight decline.
- Germany’s 10-year yield fell one basis point to -0.55%, reaching the lowest on record with its ninth straight decline.
- Britain’s 10-year yield declined 14 basis points to 0.496%, the lowest on record with the biggest drop in about three years.
- Japan’s 10-year yield declined one basis point to -0.191%, the lowest in about three years.
Commodities
- West Texas Intermediate crude fell 0.3% to $53.47 a barrel, the lowest in more than seven weeks.
- Gold climbed 1% to $1,489.14 an ounce, the highest in more than six years.
- The Bloomberg Commodity Index gained 0.1%.
