Key Events
U.S. futures for the S&P 500, Dow Jones and NASDAQ all slipped this morning, along with European stocks, as market sentiment whipsawed on the global affects of coronavirus. The reversal back to risk-off was triggered by reports of additional cases in South Korea, bringing the number of infected individuals there to 82, as well as two deaths from the virus reported in Japan.
Yields dropped, as the U.S. dollar hit a two-and-a-half-year high. Nonetheless, that didn’t stop gold from making a seven-year high. The safe haven yen, however, buckled under dollar strength.
Global Financial Affairs
While China appears to be gaining control of the spread of Covid-19, the number of cases reported in the rest of the world are picking up. As well, another change in Chinese counting methodology has caused a series of up-and-down sequences regarding the spread or containment of the virus, depending on whether one relies on global or Chinese data.
On Wednesday, all four major U.S. indices gained, with the S&P 500 and NASDAQ each hitting new all-time highs. This morning, futures contracts for the main indices pared yesterday’s gains. Indeed, Russell 2000 futures wiped out nearly all of Wednesday’s advance for the small cap index.
This remains in keeping with the recent trend of daily swings as investors fluctuate between fear and fortitude regarding the trend of the epidemic's spread and its economic impact on the world.
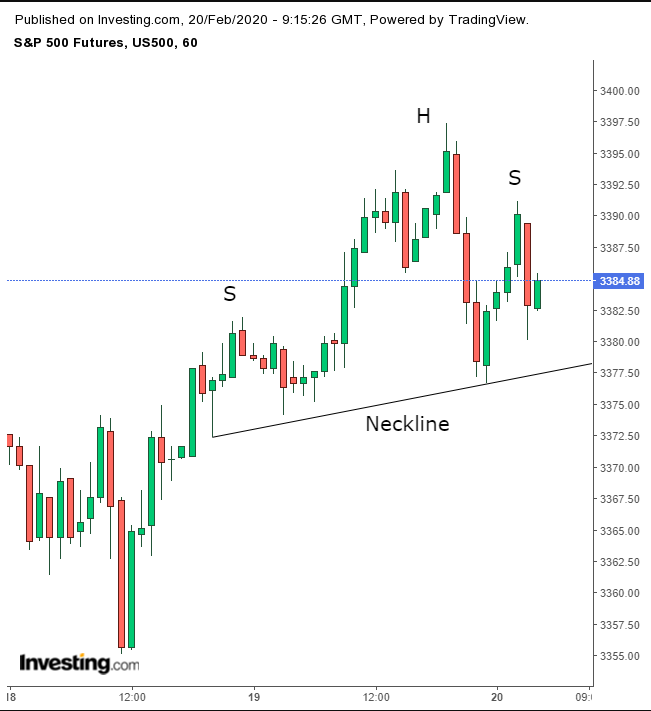
An hourly look at the S&P 500 futures chart reveals a sideways move that might become a H&S top.
A sell-off of carmakers and telecom shares pressured the STOXX Europe 600 Index lower at the open. Earlier, China’s Shanghai Composite, Japan’s Nikkei 225 and Australia’s ASX 200 rose, while Hong Kong’s Hang Seng and South Korea’s KOSPI declined.
Yields dropped for the fourth day, which means Treasury demand, including for the benchmark 10-year note, increased even after yesterday’s fresh records.
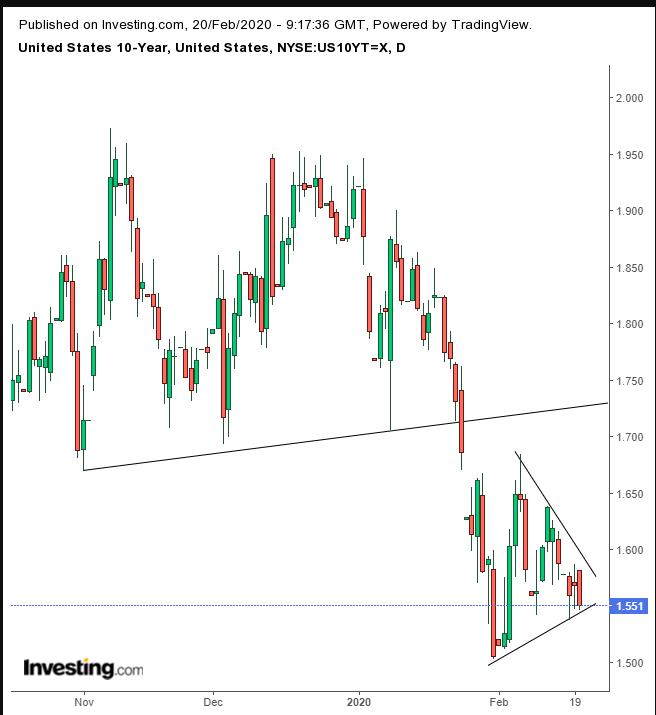
Technically, yields are struggling against the bottom of a pennant, a bearish pattern after the previous downside breakout.
Rising Treasury demand boosted the dollar, necessary for every foreign transactions.
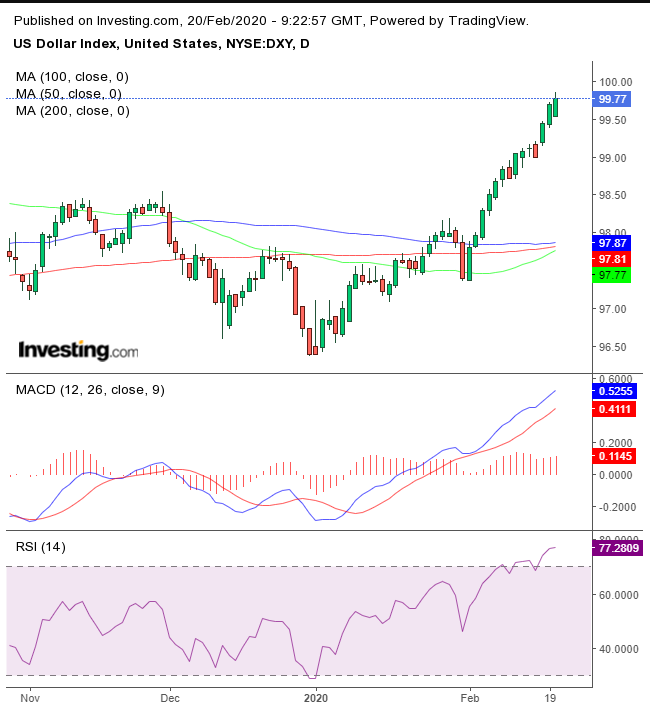
The USD reached the highest since Apr. 21, 2017. From a technical perspective, the 50 DMA is about to cross above the 200 DMA which would trigger a golden cross, whose bullish posture may be diminished by the previous sideways move, rendering moving averages somewhat impotent. Both the MACD and the RSI are the most overbought since May 2018.
The Japanese yen kept dropping past 111 per dollar on disappointing economic reports, ahead the end of the country's fiscal year next month.
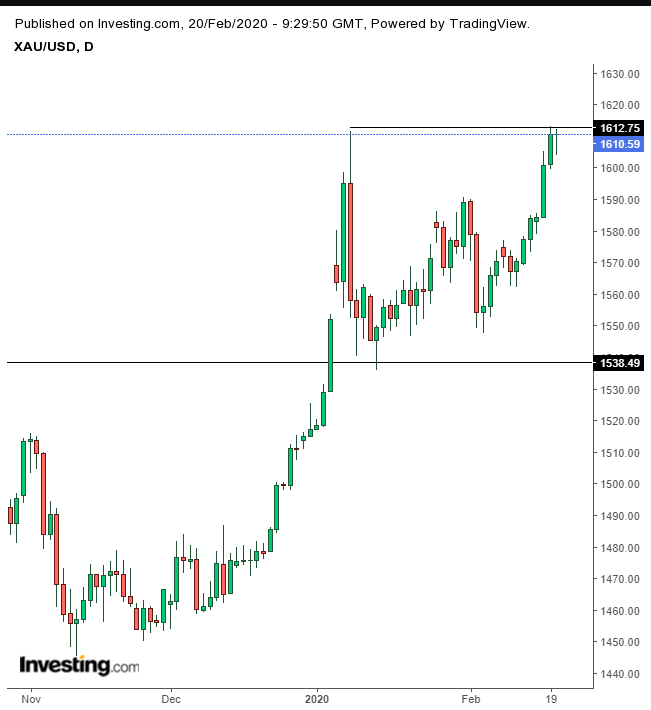
Gold retained its gains after a six day straight advance bringing the precious metal to its highest level since Mar. 21, 2013. Perhaps more noteworthy, even while stocks made fresh records yesterday, Treasurys and gold are in demand. We already discussed that the demand for U.S. Treasurys includes a FOREX transaction, buoying the dollar.
This makes gold’s momentum even more impressive. It reached a seven-year high despite the stronger dollar, gold's base currency, making the yellow metal even more expensive.
Are the same investors who are driving equites to heights as yet unknown hedging their bets? Or are we witnessing an unusual market divergence? Either which way, it’s scary.
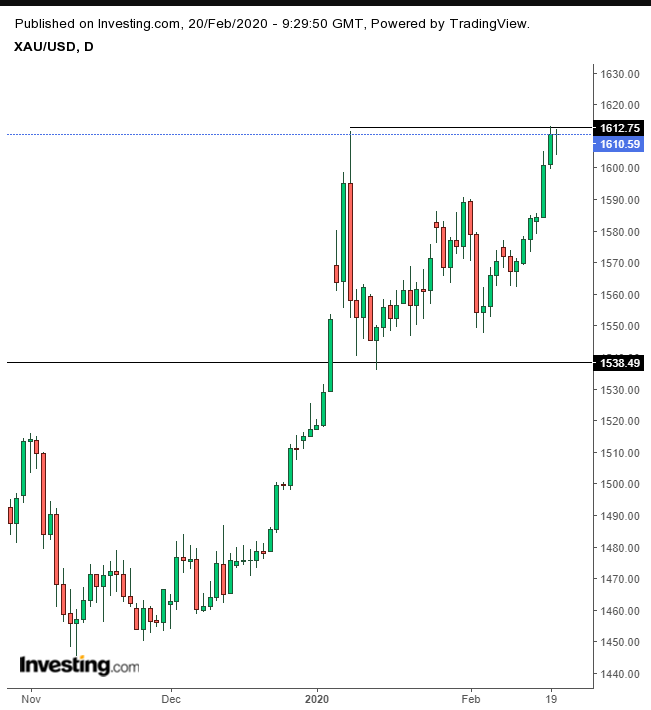
Technically, gold is struggling against the resistance of the Jan. 8 intraday high.
Oil climbed past the halfway point to $54, the highest point for the commodity since Jan. 24. Some wonder why crude is rising while market fears of the affect of coronavirus on China's economy escalate.
From a technical standpoint, however, trading developed a doji at the late-January congestion, increasing the odds of a return to a decline.
Up Ahead
- Earnings season rolls on, with results from Deere & Co (NYSE:DE) released on Friday, before the open.
- G-20 finance ministers and central bank chiefs are meet Feb. 22-23 in Riyadh, Saudi Arabia. They're expected to discuss efforts to support economic growth amid the coronavirus threat.
Market Moves
Stocks
- The Stoxx Europe 600 Index fell 0.2%.
- Futures on the S&P 500 Index decreased 0.1%.
- NASDAQ 100 Index futures dipped 0.1%.
- The MSCI All-Country World Equity Index declined 0.1%.
Currencies
Bonds
- The yield on 10-year Treasuries dipped two basis points to 1.55%.
- Germany’s 10-year yield declined one basis points to -0.43%.
- Britain’s 10-year yield slipped two basis points to 0.58%.
