- US futures, European stocks resume reflation trade
- Oil boosted by crude output disruption amid US freeze
- Copper hits decade high
- Thursday is chock full of US data, including building permits, initial jobless claims, the Philadelphia Fed Manufacturing Index and crude oil inventories.
- On Friday the UK reports retail sales, manufacturing and services PMI, Germany reports its manufacturing PMI, while Canada reports core retail sales, and finally the US reveals existing home sales.
- Futures on the S&P 500 Index decreased 0.3%.
- The FTSE 100 Index decreased 0.8%
- The MSCI Asia Pacific Index decreased 0.8%.
- The MSCI Emerging Markets Index declined 0.8%.
- The Dollar Index dipped 0.1%.
- The British pound jumped 0.3% to $1.3894.
- The euro gained 0.2% to $1.2057.
- The onshore yuan weakened 0.2% to 6.469 per dollar.
- The Japanese yen strengthened 0.1% to 105.77 per dollar.
- Britain’s 10-year yield jumped two basis points to 0.592%.
- The yield on 10-year Treasuries rose one basis point to 1.28%.
- The yield on two-Year Treasuries climbed less than one basis point to 0.10%.
- Germany’s 10-year yield gained one basis point to -0.36%.
- Japan’s 10-year yield dipped less than one basis point to 0.097%.
- West Texas Intermediate crude increased 0.8% to $61.63 a barrel.
- Brent crude gained 1% to $64.97 a barrel.
- Gold strengthened 0.3% to $1,781.89 an ounce.
Key Events
Futures contracts on the Dow, S&P, NASDAQ and Russell 2000 and European markets were lower on Thursday as as concerns that equities were becoming overvalued weighed on sentiment.
Gold and the dollar advance.
Global Financial Affairs
US indices fell away from record highs in trading on Wednesday while yields continued their dramatic rise. It appears that the reflation trade has kicked in again today, as contracts on the NASDAQ 100 were almost 0.8% deep in the red, while Russell 2000 futures were down around 0.4%.
The STOXX 600 Index opened higher on Thursday morning, as a 2% rally for miners, tracking surging copper prices, offset disappointing earnings. The reflation trade, which is based on the expectation that prices will rise because of increased economic activity pushed copper, whose demand rises with increased industrial expansion, to decade highs.
However the pan-European index dropped into the red as French telecommunications operator, Orange (PA:ORAN) fell 4.3% after posting a decline in core operating profit, and Dutch airplane manufacturer, Airbus (PA:AIR) fell 3.1% after reporting an annual loss and withholding its dividend.
European stocks may be benefiting more from the reflation trade than US futures. US stocks are falling from all-time highs as their stretched valuations are in the limelight. The value of the entire US market is more than double US GDP for the first time in history, while the pan-European benchmark is still almost 4% away from its all-time high.
Asian stocks were mixed. China’s Shanghai Composite rose over 0.5%, outperforming as it returned after the Lunar New Year. The benchmark touched a new all-time high but lost most of its gains.
Australia's ASX 200 stocks eked out a 0.01% gain as strong blue-chip earnings outweighed falling energy stocks. The rest of Asia fell, led by technology as inflation expectations grow.
US markets finished mixed on Wednesday. The Dow Jones Industrial Average registered a new record, the S&P 500 closed flat, while both the Russell 2000—representing the reflation trade—as well as the NASDAQ, representing the overheating technology sector—sold off.
The steepening incline in yields have some investors stirring uncomfortably after what feels like a ride to the moon. Rising yields will inevitably siphon away capital from the most expensive equities in history, which may be a catalyst for a major correction, even if stocks were to dust themselves off and rise with reflation.
Now, it is all about timing. At what point, will Treasuries yield sufficient returns to warrant changing assets?
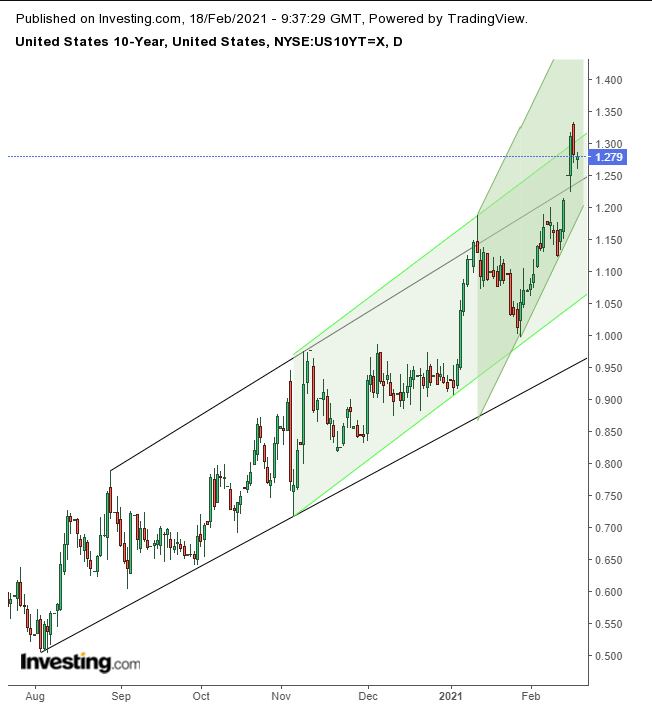
Yields on the 10-year Treasury note are down for the second day.

However, the chart shows how Treasuries are not just rising, but doing so exponentially, at an ever-escalating pace.
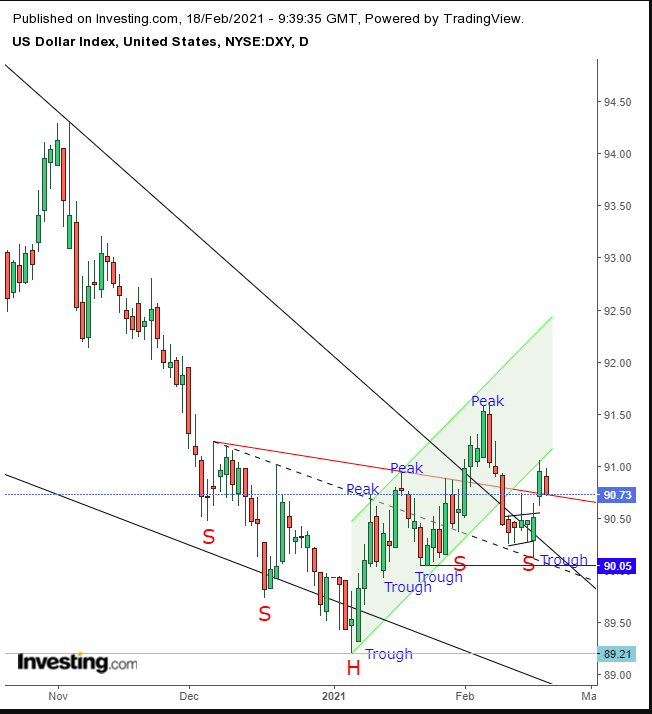
The dollar fell along with yields.

However, at least for now the greenback is finding support by the red neckline of a H&S bottom, which helped bulls complete a falling wedge.
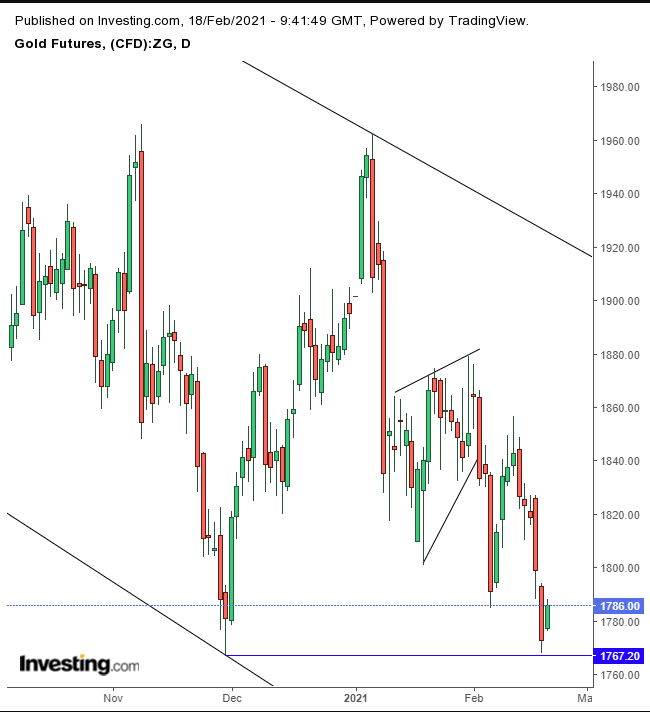
Gold rebounded from a five-day selloff.

The yellow metal had found support by the Nov. 30 low, after completing a return-move to a rising flag within a falling channel.
Bitcoin edged lower after registering a new all-time high above $52,000. We’ve cautioned it is ripe for a correction.
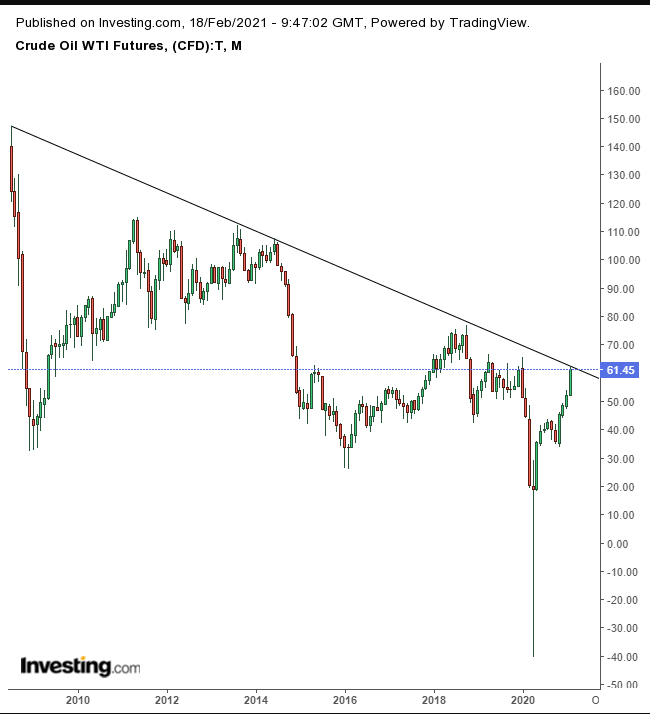
Oil was up for the second day, as a deep freeze in the US disrupted output. The price, however, gave up daily highs above $62, for the first time since January 2020. The global oil demand situation remains uncertain.

The price found a dual resistance by the 2020 highs and a long-term downtrend line since the 2008 peak.
