Quick question:
As of this weekend, which (if any) of these major indices were trading higher so far this year?
- Dow Jones Industrial Average (US)
- S&P 500 (US)
- Nasdaq Composite (US)
- Nasdaq 100 (US)
- DAX (Germany)
- CAC 40 (France)
- FTSE 100 (UK)
- EUROSTOXX 50 (Europe)
- IBEX 35 (Spain)
- FTSE MIB (Italy)
- Nikkei (Japan)
- Topix (Japan)
- S&P ASX 200 (Australia)
- Hang Seng (Hong Kong)
- KOSPI (South Korea)
The answer?
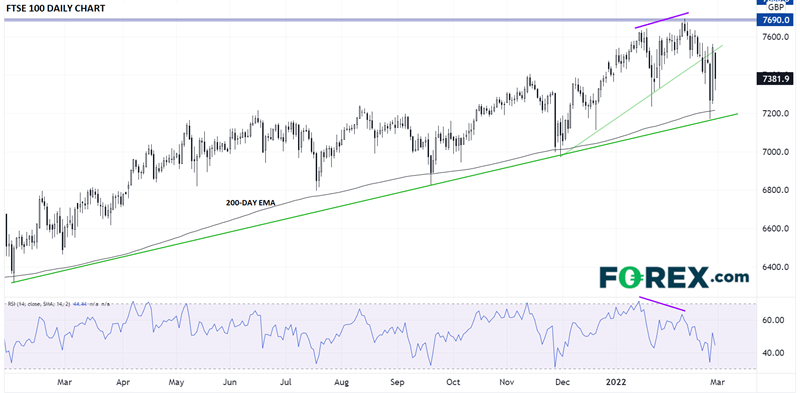
Only the UK’s FTSE 100, though as of today’s drop, the index is currently trading within a couple dozen points of its 2021 close near 7400. Regardless, the outperformance of UK equities is highly notable and impressive against a backdrop of geopolitical conflict, surging prices, and rising interest rates.
What’s driving the relative strength in UK stocks?
The simplest explanation for the strength in the UK stock market is that the construction of the FTSE index features relatively high allocations to the types of stocks that have gotten off to a strong start this year. From a industry-level perspective, the best performing sectors this year have been energy (9.5% weight in the FTSE as of December 31, 2021), financials (17.8%), and consumer staples (17.9%); in other words, nearly 50% of the index is in the three strongest sectors so far this year!
At the same time, the index features relatively low allocations to the worst-performing sectors year-to-date, including consumer discretionary (6.9% weight), communication services (4.3%), and technology (1.4%) stocks. In other words, after years of trailing other global indices due to its heavy allocation to underperforming energy and financial stocks and underweight position in the strong technology and communication sectors, the current market environment has been a near “perfect storm” scenario for the types of stocks in the FTSE index holds.
Where is the FTSE 100 headed from here?
My colleague Fiona Cincotta covered the key short-term levels to watch on the UK’s benchmark index in her “Two trades to watch” article earlier today, noting that “A break below [7400] and the 100 sma at 7370 could open the door to 7250 Friday’s low, ahead of 7185 the 2022 low. A break below this level would be significant as it would create a lower low.”
If we do see the index succumb to the broader risk-averse environment, the convergence of the 200-day EMA and rising trend line in the 7200 zone will be critical. The FTSE has already bounced off these converging support levels four times in the last 13 months, and notably, the index hasn’t seen a close below its 200-day EMA since November 2020, so a break below that level would mark a substantial change in the longer-term uptrend.

Source: TradingView, StoneX
Meanwhile, if we see headlines out of Ukraine improve and risk appetite return, the FTSE may be well-poised to extend its year-to-date outperformance with a quick recovery to its post-COVID highs near 7700. Often, the assets that outperform in a market correction are the ones that lead the way higher when the correction ends!
