VTech Holdings Ltd (0303)

Currency in HKD
51.20
+1.00(+1.99%)
Closed·
Advertisement
High dividend Yield
0303 is included in our AI-picked strategies. See how they work
Fair Value
Day's Range
50.2051.45
52 wk Range
50.1567.90
Key Statistics
Bid/Ask
51.05 / 51.20
Prev. Close
50.2
Open
50.4
Day's Range
50.2-51.45
52 wk Range
50.15-67.9
Volume
745.43K
Average Volume (3m)
937.6K
1-Year Change
-12.3288%
Fair Value
unlockUnlock
Fair Value Upside
unlockUnlock
0303 Scorecardpro icon
Company’s Health
Unlock
Fair Value
Unlock Price
Fair Price
Upside
Price Target
69.07
Upside
+34.91%
Members' Sentiments
Bearish
Bullish
ProTips
High shareholder yield

VTech Holdings Ltd News & Analysis

Show more

Technical Analysis

Summary
Strong Sell
Sell
Neutral
Buy
Strong Buy
Neutral
Technical Indicators
Neutral
Moving Averages
Neutral

Analyst Ratings

2 Buy
0 Hold
0 Sell
Ratings:
2 analysts
Overall Consensus
Strong Buy

Analysts 12-Month Price Target:

Average 69.07
(+34.91% Upside)
Firm
ArticlePositionPrice TargetUpside / DownsideFrom Price TargetActionDate
Citi
Buy69.00+34.77%76.00Maintain22/05/2026

Earnings

Latest Release
18/06/2026
EPS / Forecast
0.23 / --
Revenue / Forecast
1.04B / --
EPS Revisions
Last 90 days

Dividends

Payout Ratio
Payout ratio (TTM)
Earnings retained
EPS 0.53%
Dividend Yield
8.10%
Industry Median 1.23%
Annualised payout
4.15
Paid unevenly
5-Years Growth
-10.25%
Growth Streak

VTech (0303) Income Statement & Profits

Compare 0303 to Peers and Sector

Metrics to compare
0303
Peers
Sector
Relationship
P/E Ratio
12.3x24.3x12.5x
PEG Ratio
−0.850.470.01
Price/Book
2.6x2.8x2.4x
Price / LTM Sales
0.8x3.1x2.4x
Upside (Analyst Target)
34.9%36.0%27.4%
Fair Value Upside
Unlock4.9%3.1%Unlock

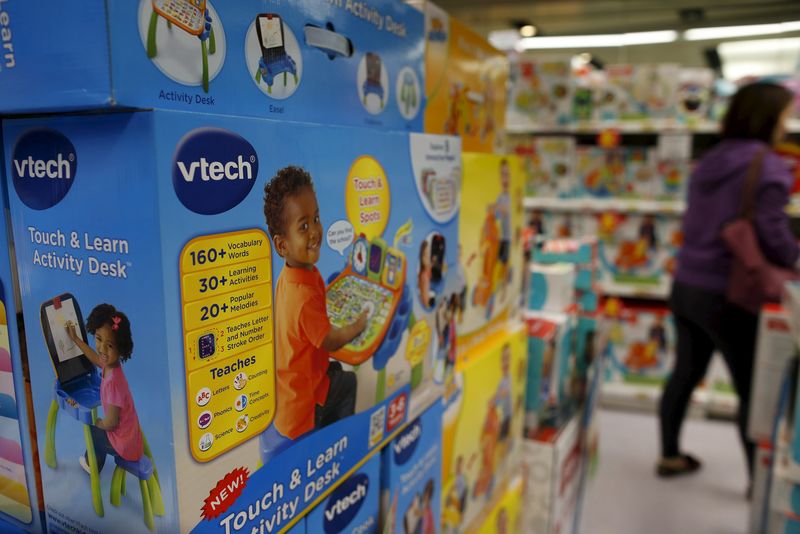
Vtech Holdings Limited, together with its subsidiaries, designs, manufactures, and distributes consumer electronic products in Hong Kong, North America, Europe, the Asia Pacific, and internationally. The company offers electronic learning toys for infancy through toddler, and preschool under the Vtech and LeapFrog brands; platform products, including motion-based learning system, smartwatches, interactive reading systems, learning globe, educational tablets, activity desks, Wi-Fi enabled smart device, and handheld communication devices, as well as educational and fun apps and games. It also provides telecommunication products, such as residential, commercial, and smartphones under the Vtech, Gigaset, snom, AT&T brands; and other telecommunication products, including baby monitors, and handsets. In addition, the company offers contract manufacturing services for customers in the areas of professional audio equipment, hearables, medical and health, and internet of things products. Further, it provides property holding, and group financing and procurement services; develops broadband connectivity software; manufactures consumer electronic products; sells telecommunication and electronic products; and manufactures and sells plastic products. Vtech Holdings Limited was founded in 1976 and is headquartered in Tai Po, Hong Kong.

Employees
20000
Market
Hong Kong

Ownership

Ownership Overview

Type
Common Stock Held% of Shares OutstandingMarket Value
Mutual Funds & ETFs
69.74M27.53%3.57B
Other Institutional Investors
8.68M3.43%444.17M
Public Companies & Retail Investors
174.88M69.04%8.95B
Total
253.29M100.00%12.97B

Top Holders

Holder
% of holding
Shares Held
Date Reported
Value (In 1,000s)
BlackRock, Inc.3.11%7,882,966403,608
Newcourt Trustees Limited2.84%7,188,603368,056

People Also Watch

3.68
0327
+3.37%
20,089
EXXJ
+1.05%
204.80
0522
+5.46%
0.900
0732
-2.17%

FAQ

What Is the VTech (Hong Kong: 0303) Share Price Today?

The VTech stock price today is 51.20 HKD.

What Stock Exchange Does VTech (0303) Trade On?

VTech is listed and trades on the Hong Kong Stock Exchange.

What Is the Ticker (Stock Symbol) for VTech?

The stock symbol (also called a 'ticker') for VTech is "0303."

Does VTech Pay Dividends? What’s The Current 0303 Dividend Yield?

Yes, 0303 Pays Dividends to its Shareholders. The current VTech dividend yield is 8.1%.

What Is the Current VTech Market Capitalisation?

As of today, VTech (Hong Kong: 0303) market cap is 12.97B HKD.

What Is VTech's (0303) Earnings Per Share (TTM)?

The VTech EPS is currently 0.53 (Trailing Twelve Months).

Is 0303 a Buy or Sell From a Technical Analyst Perspective?

Based on today's VTech moving averages and other technical indicators, the daily buy/sell signal for 0303 stock is Strong Sell.

How Many Times Has VTech Stock Split?

VTech has split 1 times. (See the 0303 stock split history page for full effective split date and price information.)

How Many Employees Does VTech Have?

VTech has 20000 employees, based on their latest Companies House report.

What is the current trading status of VTech (Hong Kong: 0303)?

As of 05/07/2026, VTech (0303) is trading at a share price of 51.20 HKD, with a previous close of 50.20 HKD. The stock has fluctuated within a day range of 50.20 HKD to 51.45 HKD, while its 52-week range spans from 50.15 HKD to 67.90 HKD.

What Is VTech (0303) Price Target According to Analysts?

The average 12-month price target for VTech is 69.07 HKD, with a high estimate of 69.0745098 HKD and a low estimate of 69.0745098 HKD. 2 analysts recommend buying the stock, while 0 suggest selling, leading to an overall rating of Strong Buy. The stock has an +34.91% Upside potential.
Risk Disclosure: Trading in financial instruments and/or cryptocurrencies involves high risks including the risk of losing some, or all, of your investment amount, and may not be suitable for all investors. Prices of cryptocurrencies are extremely volatile and may be affected by external factors such as financial, regulatory or political events. Trading on margin increases the financial risks.
Before deciding to trade in financial instrument or cryptocurrencies you should be fully informed of the risks and costs associated with trading the financial markets, carefully consider your investment objectives, level of experience, and risk appetite, and seek professional advice where needed.
Fusion Media would like to remind you that the data contained in this website is not necessarily real-time nor accurate. The data and prices on the website are not necessarily provided by any market or exchange, but may be provided by market makers, and so prices may not be accurate and may differ from the actual price at any given market, meaning prices are indicative and not appropriate for trading purposes. Fusion Media and any provider of the data contained in this website will not accept liability for any loss or damage as a result of your trading, or your reliance on the information contained within this website.
It is prohibited to use, store, reproduce, display, modify, transmit or distribute the data contained in this website without the explicit prior written permission of Fusion Media and/or the data provider. All intellectual property rights are reserved by the providers and/or the exchange providing the data contained in this website.
Fusion Media may be compensated by the advertisers that appear on the website, based on your interaction with the advertisements or advertisers.
© 2007-2026 - Fusion Media Limited. All Rights Reserved.