- Powell warned of long-lasting economic damage from the pandemic
- Gold at highest level in a month, surging despite US dollar holding its ground
- Oil slumps
- US Producer Price Index figures for May will be released later today. Expectations are for a 0.1% reading, up from -1.3% last month.
- UK GDP will be reported on Friday. It's anticipated to come in at -22.3% YOY, significantly lower than last month's -5.7%.
- Futures on the S&P 500 Index sank 1.7%.
- The Stoxx Europe 600 Index slumped 2.3%.
- The MSCI Asia Pacific Index dropped 1.8%.
- The MSCI Emerging Markets Index dipped 1.1%.
- The Dollar Index was flat.
- The euro declined 0.2% to $1.1349.
- The British pound sank 0.7% to $1.2661.
- The onshore yuan weakened 0.2% to 7.075 per dollar.
- The Japanese yen strengthened 0.1% to 107 per dollar.
- The yield on 10-year Treasurys declined two basis points to 0.71%.
- The yield on two-year Treasurys climbed one basis point to 0.17%.
- Germany’s 10-year yield decreased four basis points to -0.38%.
- Britain’s 10-year yield sank five basis points to 0.214%.
- Japan’s 10-year yield dipped one basis point to 0.013%.
- West Texas Intermediate crude declined 4.1% to $37.98 a barrel.
- Brent crude sank 3.6% to $40.23 a barrel.
- Gold weakened 0.2% to $1,735.10 an ounce.
Key Events
Futures for all major US indices—the Dow Jones, S&P 500, NASDAQ and Russell 2000—fell on Thursday, together with global stocks after the Federal Reserve dispelled expectations for a V-shaped recovery on Wednesday, citing potential long-term economic damage from the COVID-19 pandemic.
The dollar selloff continued and yields headed lower. Gold surged.
Global Financial Affairs
Contracts on the four indices dropped deep into the red after Fed boss Jerome Powell warned that the current health crisis may have wreaked long-term damage on the US economy.
Futures for the Russell are underperforming at the time of writing, (-3.4%), while contracts on the NASDAQ are 'outperforming,' (-1.4%), after yesterday’s historic record set by the underlying benchmark. Over the past two days we've been pointing out the development of a H&S top on the hourly chart of S&P 500 futures.
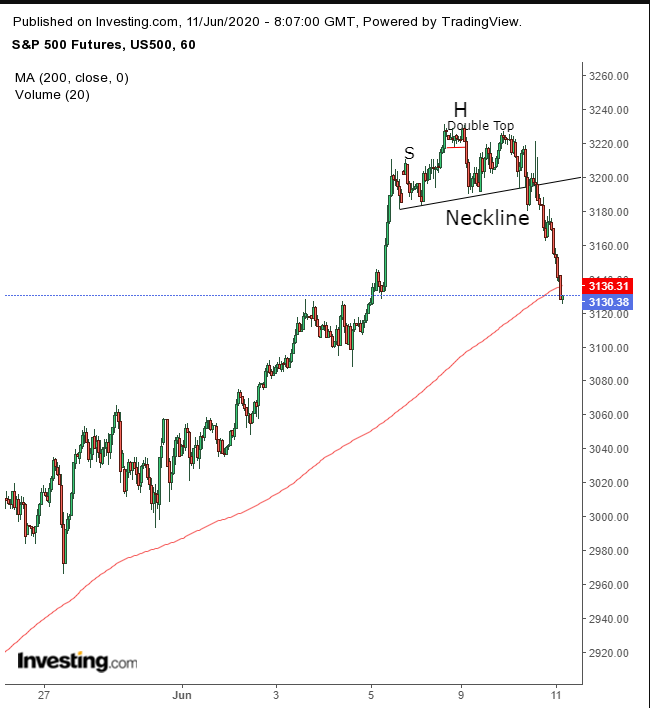
The fall that followed the pattern's formation increased the odds of a pullback in the short term. For now, however, the index remains in an uptrend, at least for the medium-term. Only a fresh all-time high would turn this into a long-term uptrend, though we have noted for a while now there's a Broadening Pattern in place since January 2018 for the underlying gauge, something investors might want to watch.
As for yesterday's Fed warning on the speed of an economic recovery, this isn't the first time the Fed chair has issued this type of forecast. Indeed, along with the IMF and many well-known money managers, the US central bank has been consistently pessimistic about a rapid economic recovery after coronavirus, yet stocks have continued to climb. Now, that recent data has surprised for the better, will investors suddenly decide to heed the experts?
Perhaps, now that there's another wave coronavirus cases hitting the US as lockdowns ease, traders will turn more cautious. However, this metric hasn't been a consistent pressure on markets, nor even very relevant since the March low.
Travel firms and bank shares, all of which recently advanced, weighed on the Stoxx Europe 600 Index this morning, pulling it to a dramatically lower open.
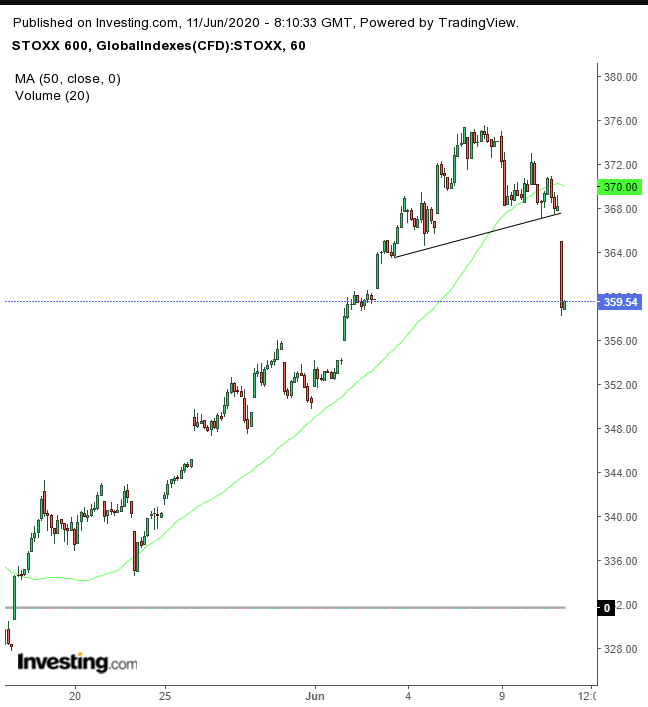
It was the fourth straight daily decline, completing a H&S top on the hourly chart, similar to that on the S&P 500 futures.
Asia, too, was completely in the red on Thursday. Australia’s ASX 200 headed the Fed's warning most closely, (-3.00%), while China’s Shanghai Composite continued to outperform, (-0.8%), despite lingering uncertainties over the tariff war with the US and a world still finger-pointing about the worst global pandemic in more than 100 years.
Yields on US Treasurys slipped for the fourth straight day, with the 10-year note seeing its biggest drop in eight weeks, after the Federal Reserve signaled rates will stay at zero until 2022.
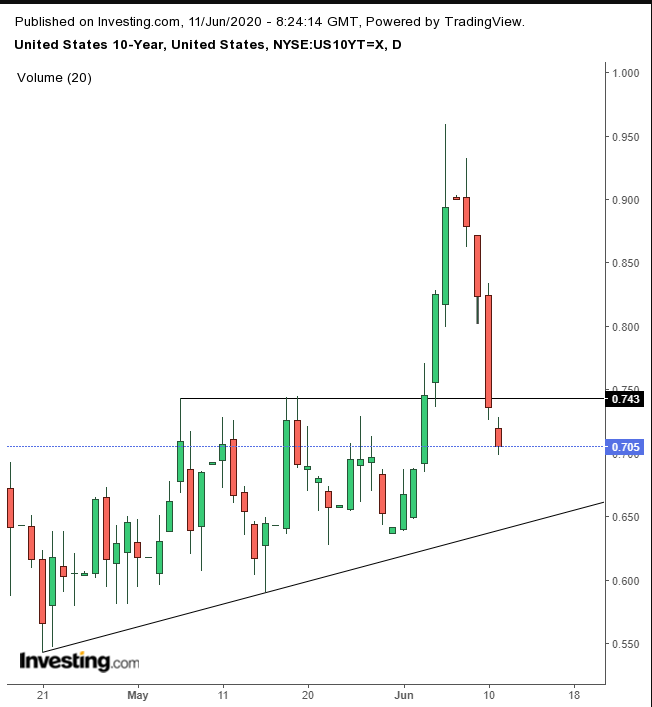
Yields on the benchmark Treasury fell back into an ascending triangle, after achieving its implied target.
The dollar selloff continued for the third straight day, for nine days out of 10 after the Fed's stark warning.
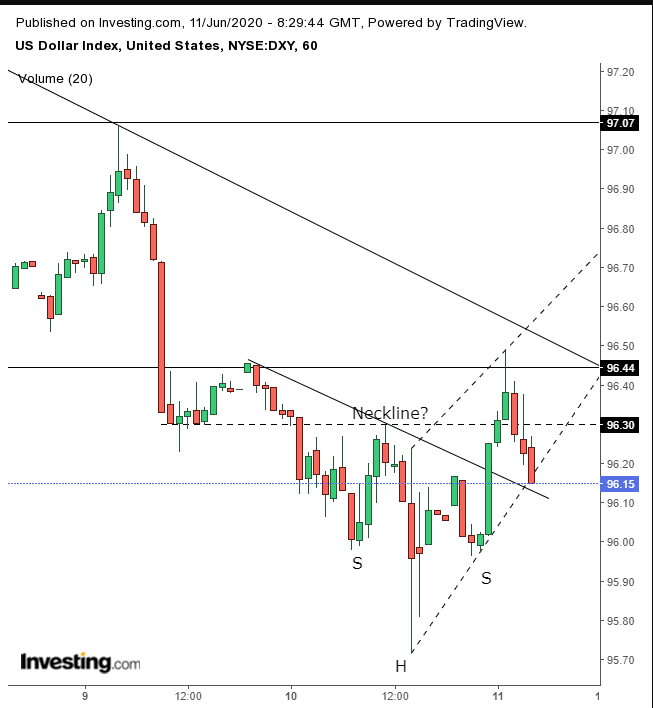
However, the DXY closed well off its lows yesterday, potentially forming a daily hammer. The price is fluctuating today, forming an intraday high-wave candle, which—like the hammer—may signal a reversal. On the hourly chart, the USD may have completed a H&S bottom, which, after a return move is being tested as we write.
Gold jumped, on both risk-off sentiment and overall dollar weakness, though right now the dollar appears to be holding its own.
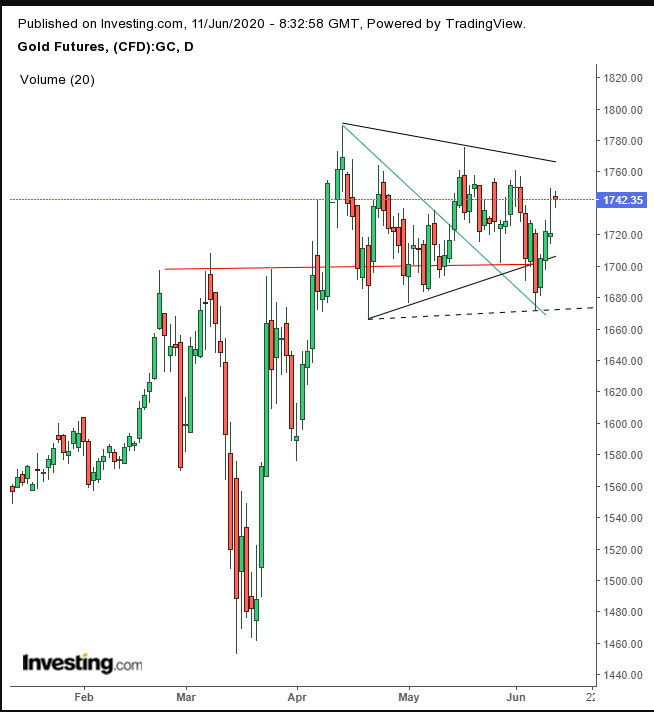
The precious metal has moved toward the top of a range since it completed a H&S continuation pattern. This is gold’s fourth straight day of gains, the longest winning streak since it began developing the H&S in February.
Crude oil retreated from a second-day advance. It moved along a pennant formation, whose upside breakout would signal a resumption of the underlying uptrend.
