- European earnings disappoint
- US-China diplomatic spat escalates further
- US Factory Orders data for June is due Tuesday.
- Eurozone Non-Manufacturing PMI reports are scheduled for Wednesday.
- US unemployment and jobs releases are expected Friday.
- The Stoxx Europe 600 Index gained 0.2%.
- Futures on the S&P 500 Index rose 0.2%.
- Nasdaq 100 Index futures climbed 0.2%.
- The MSCI Asia Pacific Index increased 1.8%.
- The Dollar Index fell 0.1%.
- The euro climbed 0.2% to $1.1785.
- The Japanese yen was little changed at 105.90 per dollar.
- The South African rand strengthened 0.3% to 17.1385 per dollar.
- The yield on 10-year Treasuries declined less than one basis point to 0.55%.
- The yield on two-year Treasuries rose less than one basis point to 0.11%.
- Britain’s 10-year yield increased less than one basis point to 0.087%.
- Germany’s 10-year yield climbed less than one basis point to -0.52%.
- West Texas Intermediate crude fell 0.3% to $40.90 a barrel.
- Gold weakened 0.1% to $1,975.84 an ounce.
- Iron ore climbed 1.1% to $111.65 per metric ton.
Key Events
European stocks slumped on Tuesday after opening higher, dragged down by disappointing earnings from Diageo (LON:DGE) and Bayer (DE:BAYGN). US futures for the Dow Jones, S&P 500, NASDAQ and Russell 2000 sagged as well.
In addition, markets continue to await clues on additional coronavirus relief funding from the US government, which is currently at a stalemate.
Earlier, US contracts were trading higher, along with Asian shares, boosted by Monday's tech-led rally on Wall Street. The New York session was highlighted by new records for the NASDAQ Composite and NASDAQ 100 indices, as investors put all their firepower into buying companies expected to outperform amid a work-from-home economy.
The dollar dropped once again while gold accelerated.
Global Financial Affairs
During Monday's US session, big tech shares such as Apple (NASDAQ:AAPL) and Microsoft (NASDAQ:MSFT) surged. Sentiment was buoyed by news there were signs the pandemic could be slowing in the US.
Despite yesterday's exuberance, as of this writing, the ES is dropping.
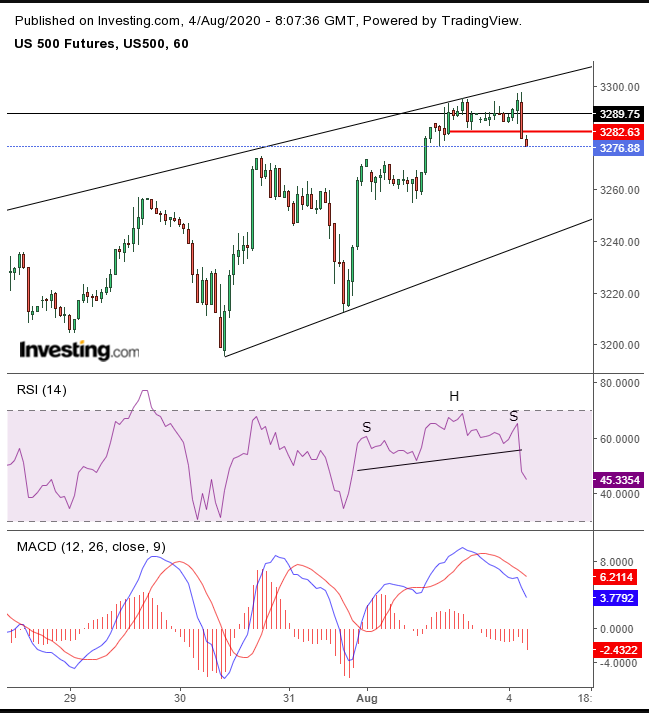
Technically, SPX futures have topped out, increasing the potential for a return toward the bottom of a rising channel developed after the July 24 bottom. Both the MACD and RSI also topped. The former entered a bearish formation and the RSI completed a H&S top.
The Stoxx Europe 600 Index initially advanced, boosted by auto and banking shares. But weak earnings from alcoholic beverage giant Diageo and global healthcare colossus Bayer provided no joy for the growth-oriented cyclical sector.
The Asian session was mixed, though regional indices mostly gained, on better-than-expected US manufacturing PMI data. However, stocks closed off their highs.
Hong Kong’s Hang Seng provided the best regional returns, (+2.1%). It was one of those rare days when Chinese investors actually considered current events and the Shanghai Composite underperformed. (+0.1%), pressured by the increasing likelihood of a US-China cold war, as Beijing threatened retaliation, with Washington saying it will no longer renew visas for Chinese journalists.
This latest development is another level of hostility in an ever-growing series of tit-for-tat moves between the world’s largest economies. It comes after President Donald Trump threatened to block Chinese owned social media platform TikTok in the US, citing national security concerns.
Treasuries appeared to have found renewed demand after the US manufacturing release showed expansion in July, at the fastest pace since March 2019.
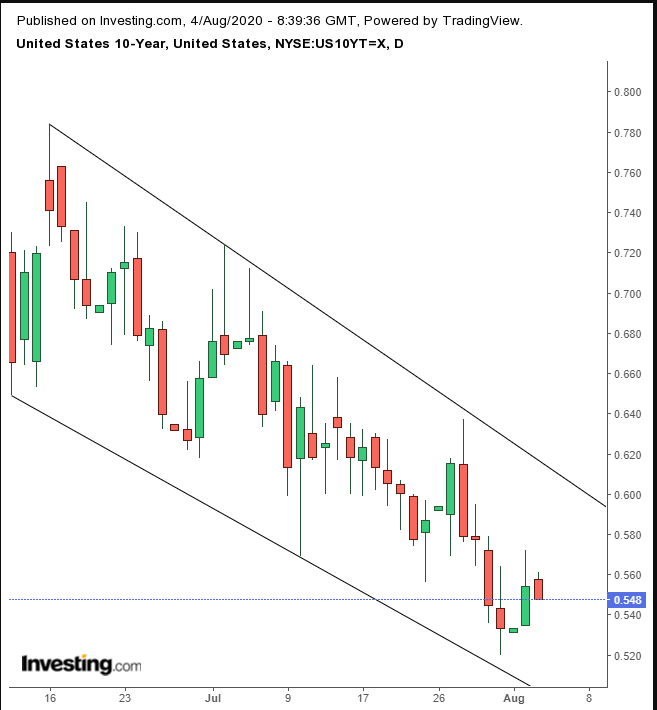
Yields, including for the 10-year benchmark, gave up gains and fell to losses, paring Monday’s jump.
Similarly, the Dollar Index surrendered early gains, ending what could have been a third-day advance. Yesterday’s bearish pushback provided a heads-up for today’s selloff.
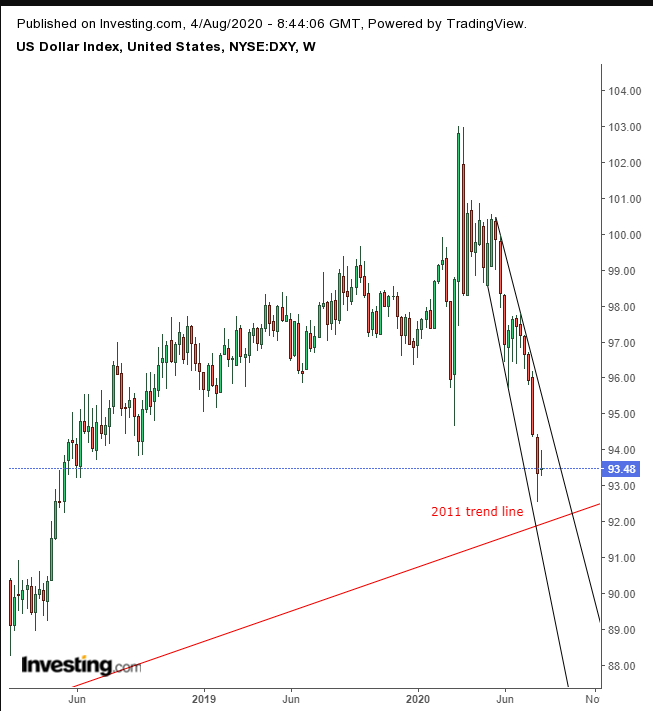
The USD is being squeezed right now—between the pressures of the falling channel developed after the March high and a long-term uptrend line since 2011.
Gold is priming for a pull back.
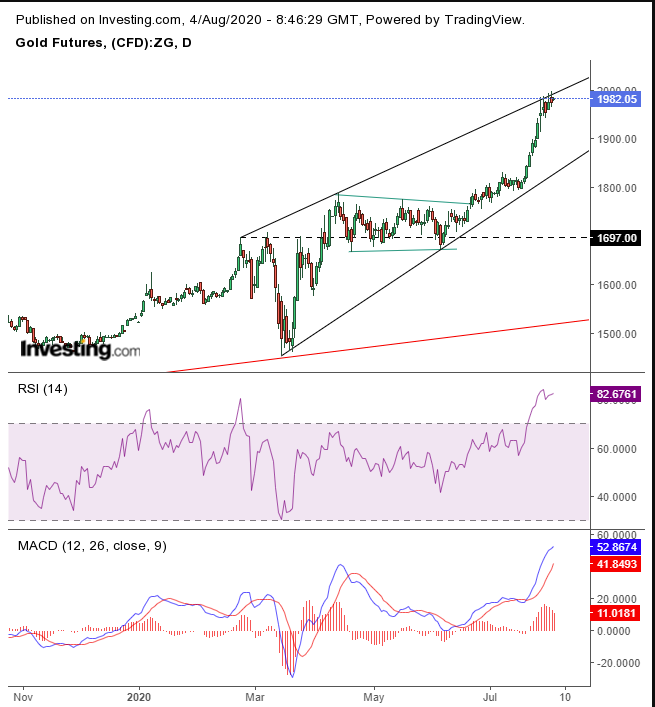
The precious metal is heading toward the bottom of its rising channel, after a breathtaking climb that followed months of trader indecision, spiking both momentum and price average interplay to extreme oversold conditions.
A senior analyst at Oppenheimer, the investment bank and asset management firm, said he would go for Bitcoin over gold since both safe havens are rallying right now. Gold has already had a great run he noted, while Bitcoin just experienced a major breakout, which could be the start of another long-term rally.
He noted that the cryptocurrency was reversing its downtrend, which began at BTC's 2017 high.
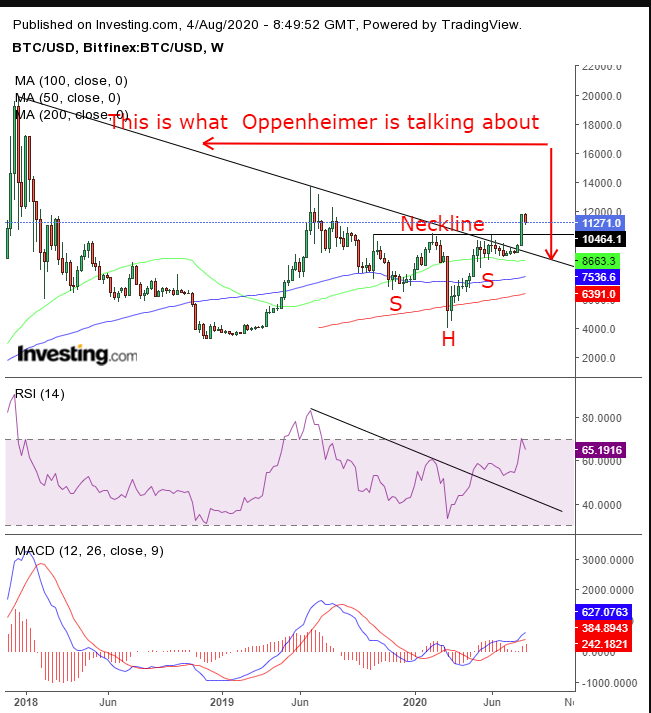
Note the price breaking out of that long-term downtrend line in the chart above. What the analyst didn’t mention is the massive, 10-month, H&S bottom. It adds serious weight to the presumed demand-pressure of the breakout.
The weekly 200 DMA supported the price since the digital currency was launched. It did so again in March. The 50-week MA crossed over the 100-week MA in December 2019, placing the major MAs: 50, 100 and 200 within a bullish pattern, as each shorter MA rises above a longer one, demonstrating that current prices are on an upward trajectory.
Oil, however, is on a slippery slope, no longer trading above $41.
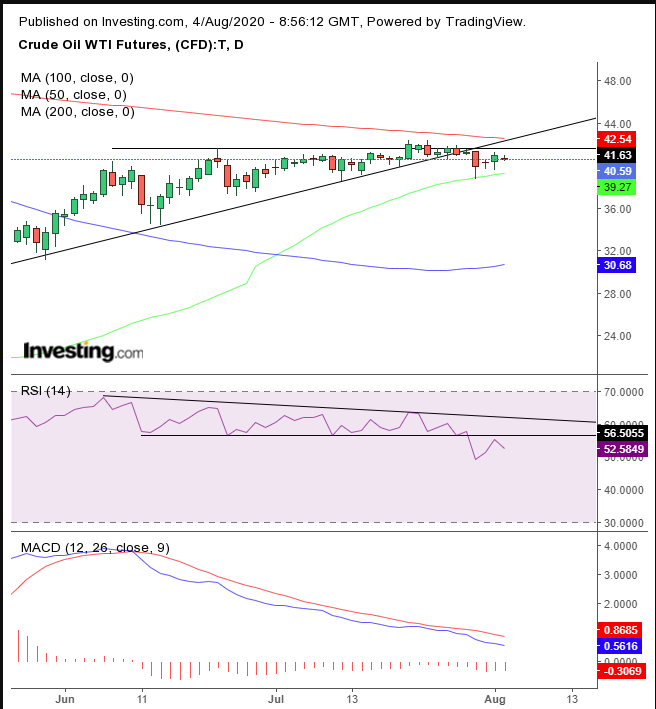
The commodity's price has fallen below its uptrend line since May 22, the bottom of a rising triangle—which occurs when demand outpaces supply. Yet instead of rising, the price fell, a very bearish sign.
As well, WTI is sitting between the 200 and 50 DMA, but the 200 DMA is four times as powerful as the 50 DMA, making a descent much more likely. Plus, note how the MACD has been sinking and the RSI providing a negative divergence, forming a descending triangle. This suggests a continued drop, in complete opposite to the price’s failed ascending triangle.
