- Is there enough optimism left to carry stocks higher
- How sustainable is the current economic recovery narrative
- Which will give in – equities or gold and Treasuries?
Amid thin trading and signs the economic recovery is losing momentum, most stocks closed lower on Friday. Adding to the gloom: Congressional negotiations over additional pandemic relief have gone nowhere and likely won't start again for weeks, now that US legislators have gone on holiday through the end of August. We expect this conviction to endure into the upcoming trading week.
Treasurys rose on Friday, for the first time last week; the dollar fell for a third day. Gold ended its rally and oil dropped for a second day.
Any Steam Left To Take Stocks Higher?
On Friday, the S&P 500 slipped, albeit just 0.02%. Energy shares rose almost a full percent, despite a decline in oil prices, as demand faces a bigger coronavirus shock than expected. In addition, natural gas soared almost 8% after a heat wave hit large parts of the US, offsetting a sell-off of Utilities shares, (-0.9%).
The NASDAQ fell 0.2%, the Russell 2000 dropped 0.3%, but the mega cap Dow Jones bucked the trend, eking out a 0.1% gain.
Trading volume was roughly 10% below the 30-day average during the final trading day of the week, which also marks the halfway point of August.
Still, for the week, all four major US indices advanced.
The S&P 500 rose 0.6% on a weekly basis after touching its record close on an intraday basis on both Thursday and Friday. Nevertheless, it still finished the week 0.4% from its highest close ever.
After Technology shares fueled the unbelievable 50.51% rally from the March lows, amid the worst pandemic in 100 years, the tech sector was flat for the week. Three old school sectors—Industrials (+3.2%), Energy (+2.7%), and Consumer Discretionary (+2.3%), led stocks higher instead, bringing equities to within a whisper of their previous record.
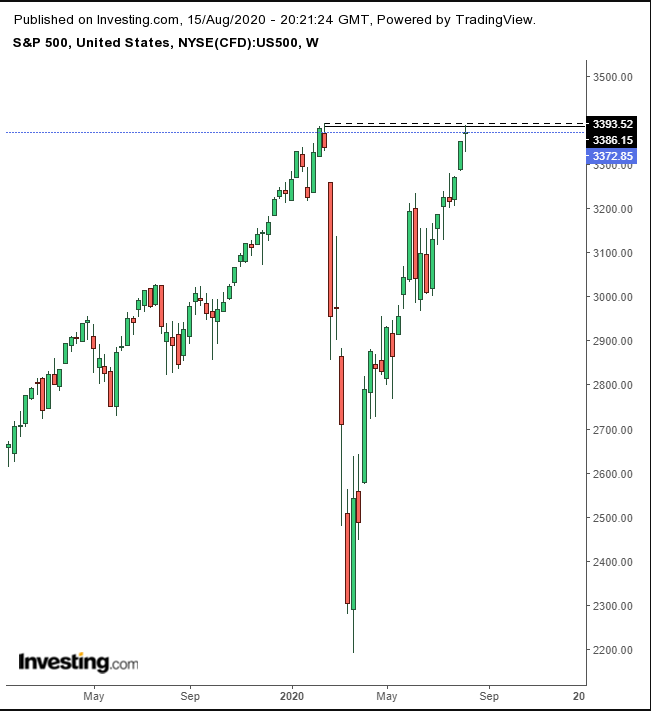
Though three of the four main indices may have produced weekly bearish candles, the most significant was made by the S&P 500, as it confirmed February's all-time high resistance. Trading created a Dragonfly Doji, and the low volume reinforced the possibility of a confirming follow-up, with a lower close.
But, now that stocks have mostly recouped pandemic losses, do investors have any steam left to take stocks higher? Market participants might be finding the various economic reports confusing. Core retail spending rose in July for the third straight month, topping pre-pandemic levels, as first time weekly unemployment claims fell below 1 million, a level not seen in 21 weeks, since the start of the pandemic in the US.
Still, the American economy has an uphill battle. It's undergoing the worst recession since the Great Depression of the 1930s.
For now, though, Americans haven't stopped spending, despite the risks, which would suggest they're optimistic about the economy going forward. In reality though, that's not the case. Most US residents expect it will take at least five years for the country's economy to stabilize.
The fact is, the US economy just posted its worst drop in GDP ever. From April to June it contracted by an annual rate of 32.9%, almost four times worse than the decline seen during the peak of the financial crisis, when the economy contracted by an annual rate of 8.4% in the fourth quarter of 2008, something that, ironically, seems rather benign today. And with small businesses struggling as COVID-19 continues to rage, we should expect further pressure on growth, which could add to the already existing 15.5 million continuing jobless claimants.
We've repeatedly cautioned during recent months when better-than-expected economic data has been released—including some of the best on record—that those metrics don't necessarily represent a stable, sustainable economic recovery, considering the positive data followed some of the worst numbers in history. Indeed, we called the recovery a dead-cat bounce.
There are now a slew of experts asserting the economic recovery is faltering, as both consumers and businesses turn cautious. US retail sales declined, and industrial output is indicating an anemic recovery. And if lawmakers can't come to some settlement on additional recovery aid, data will turn markedly sour.
So why is the stock market at such nosebleed levels? Blame it on unprecedented government stimulus with a standing Fed promise of infinite QE.
Here's a good example of the total fiscal disconnect: gold is at record highs and yields are near record lows. Stocks, for all their vaunted gains, are actually on the verge of a lost year—the SPX is up a mere 4% YTD, after 2019’s 16%. Overall, that's not especially impressive. Moreover, financial managers are losing faith in this too-good-to-be-true rally, which ignores the stimulus deadlock.
The VIX has been falling since the March highs.
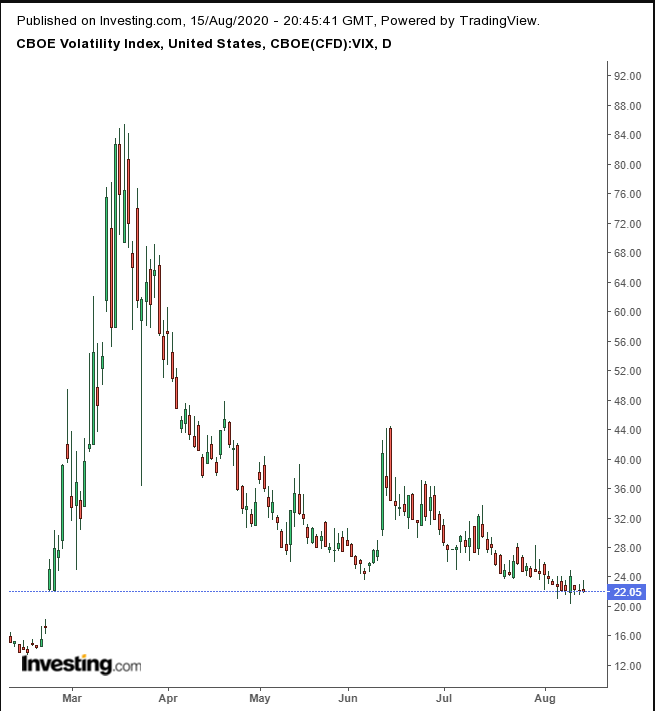
Nonetheless, the 'fear' gauge remained above its rising gap of Feb. 24 since Aug 6.
Yields, including for the 10-year benchmark note, climbed the most since June, peaking above a potential descending channel, after cutting through the 50- and 100-DMAs.
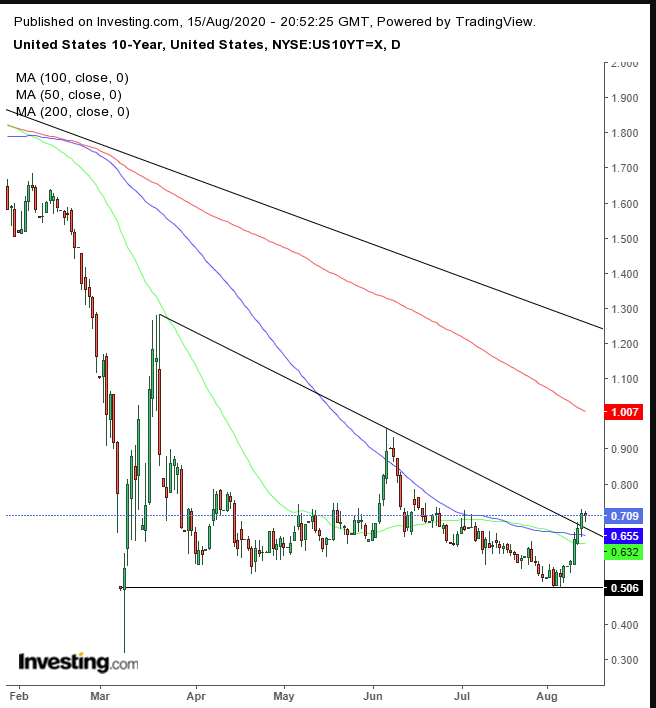
However, rates have been falling since the October 2018 highs of 3.25%, well before there were any outbreaks that would eventually become the current pandemic. The uptrend line marking that downtrend remains well above, at 1.25%; below that looms the 200 DMA, currently above the 1.00% psychological level.
The Dollar Index fell for a third day.
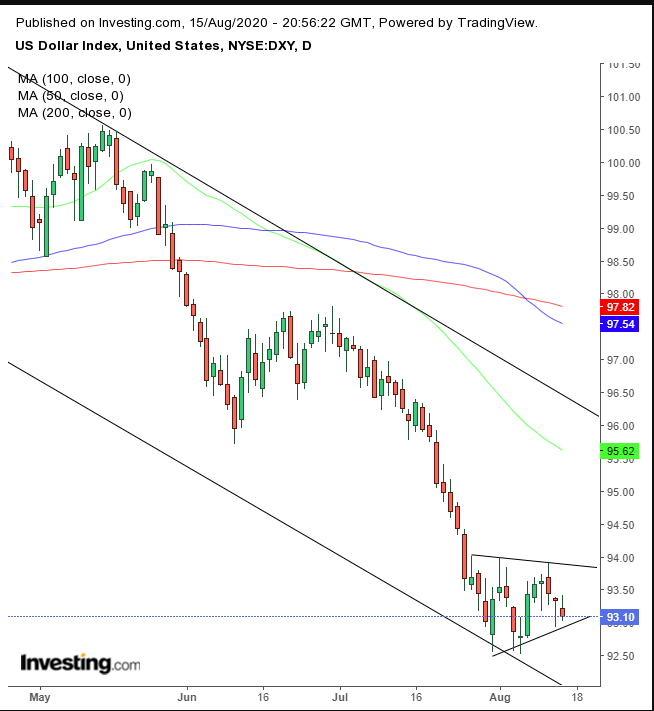
But the USD found support at Thursday’s extremely bullish hammer, with an extraordinarily long lower shadow, hammering out the bottom of a pennant. A downside breakout would extend the falling channel in place since the March 19 high. On the other hand, the uptrend line since 2009 waits at around the 91.50 level.
Gold ended a two-day rally last week, to post a 3.4% selloff, the worst since March. Despite the drop, the precious metal remained 2.2% above its previous all-time high.
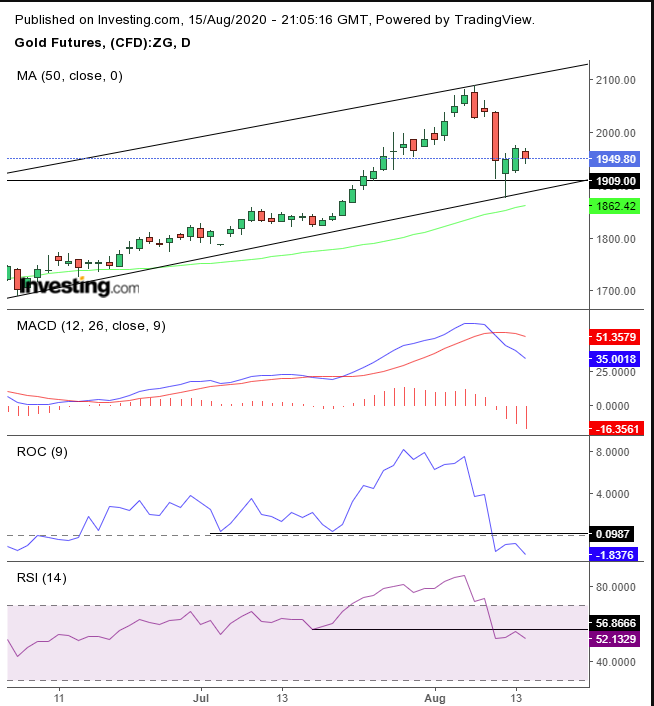
The question is whether investors took profit on the precious metal only because of the much publicized all-time high, gold's first since 2011, or because the S&P 500 came within a hair of its record, and investors are expecting it to join the NASDAQ indices at new record peaks.
While the price of the yellow metal remained within a rising channel after finding support at its bottom, the MACD, RSI and ROC all topped out.
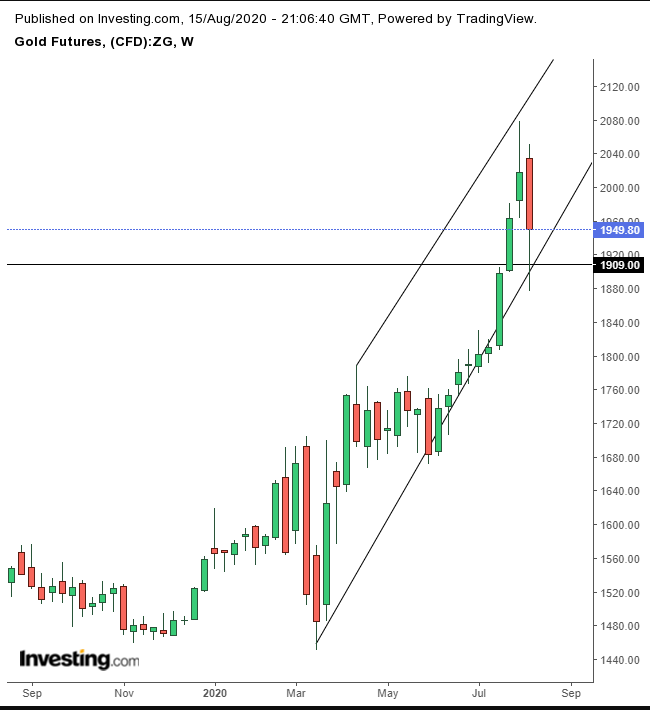
On the weekly chart, the candle completed a Bearish Engulfing pattern, following a cross between a shooting star and a high-wave candle.
On Friday, oil fell for a second day. It was still up though, for a second week in a row, boosted by a third week of drawdowns for crude inventories.
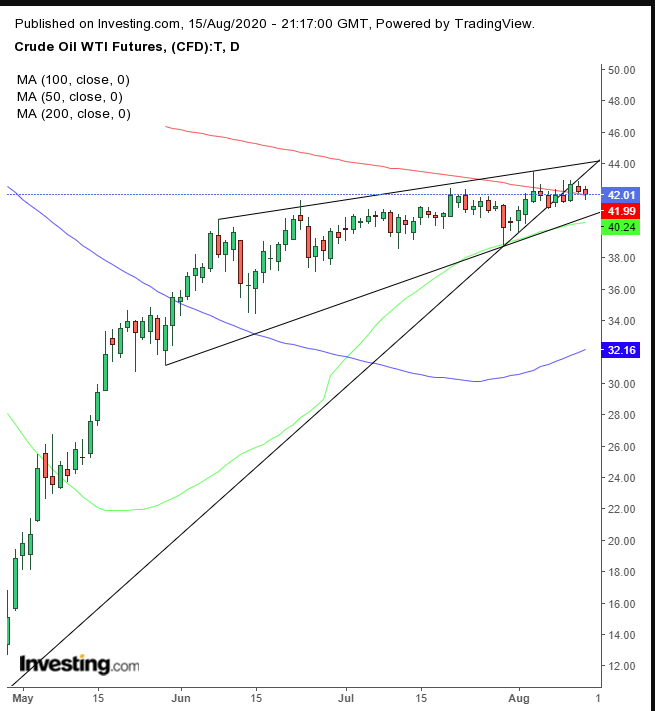
Despite Friday’s second-day slump, the price of WTI remained above the 200 DMA for a third day, even as it slipped below a continuously redrawn uptrend line, as the price keeps making incremental highs.
However, our concern is that crude oil bulls could lose patience as the commodity's advances are few and far between, according to the dynamics of a rising wedge. The confusion is that this bearish pattern makes sense when it follows a fall, not a rise, as is the case right now.
The Week Ahead
All times listed are EDT
Sunday
19:50: Japan – GDP: expected to have plunged to -7.6% in Q2, from -0.6% previously.
Monday
00:30: Japan – Industrial Production: anticipated to have risen to 2.7%.
08:30: US – Empire State Manufacturing: seen to have fallen to 15.00 from 17.20.
Tuesday
08:30: US – Building Permits: predicted to climb to 1.313 million from 1.258 million.
Wednesday
02:00: UK – CPI: expected to remain flat at 0.6%.
05:00: Eurozone – CPI: seen to remain at 0.4%.
08:40: Canada – CPI: anticipated to have dropped to 0.4% from 0.8% previously.
10:30: US – Crude Oil Inventories: last week's release showed a drawdown of -4.512M bbls.
14:00: US – FOMC Meeting Minutes
Thursday
07:30: Eurozone – ECB Publishes Account of Monetary Policy Meeting
08:30: US – Initial Jobless Claims: last week's release came in at 963K.
08:30: US – Philadelphia Fed Manufacturing Index: seen to edge higher to 20.5 from 24.1.
Friday
02:00: UK – Retail Sales: probably plunged to 2.3% from 13.9%.
03:30: Germany – Manufacturing PMI: seen to have edged up to 52.5 from 51.0.
04:30: UK – Manufacturing PMI: anticipated to have gained slightly, to 53.6 from 53.3.
04:30: UK – Services PMI: likely to have ticked higher, to 57.0 from 56.5.
08:30: Canada – Core Retail Sales: expected to have jumped to 15.0% from 10.6%.
10:00: US – Existing Home Sales: to rise to 5.39 million from 4.72 million.
