- Geopolitical risk from Hong Kong, Argentina, Italy keeps U.S. futures, European shares under pressure
- Multi-year low in Treasury yields raises red flag for equities
- Gold hits new 6-year high; yen climbs to highest level since Brexit vote
Key Events
Futures on the S&P 500, Dow and NASDAQ 100 and global stocks extended a selloff this morning as some hot spots of geopolitical risk flared up on Tuesday, adding to the fire of the U.S.-China trade war escalation. Meanwhile, tumbling Treasury yields spooked markets as they hit a new multi-year low amid investors' flight to safety, which propped up the yen and gold even amid a strengthening dollar.
Fresh warnings from Hong Kong's government against escalating civil tensions and a currency crash in Argentina amplified downward market pressure stemming from the most recent trade blows between the world’s two largest economies, with U.S. President Donald Trump threatening to walk away from talks altogether.
Heightened political uncertainty in Italy also pressured the STOXX 600 lower for the third day, to extend a drop below the 200 DMA after opening in the red with industrial firms and banks. Should the pan-European benchmark drop 1% further, it would complete a double top.
In the earlier Asian session, Hong Kong’s Hang Seng (-2.10%) underperformed as violent clashes between the police and protesters continued.

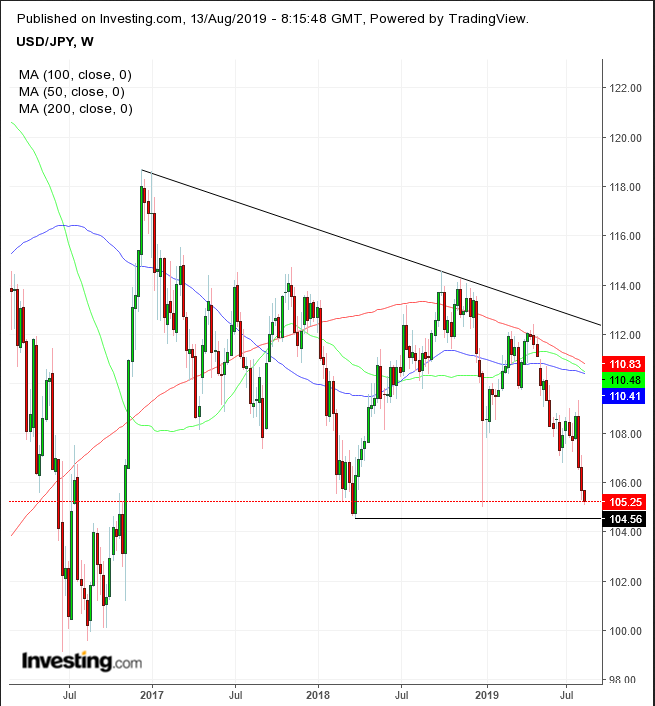
Japan’s Nikkei 225 (1-11%) lagged, as stocks were weighed by the strongest yen since March 2018. This level is in turn only 0.6% above the lowest level since Nov. 2016, in the aftermath of the historical Brexit vote: if prices do get there, they will have completed a massive descending triangle.
Global Financial Affairs

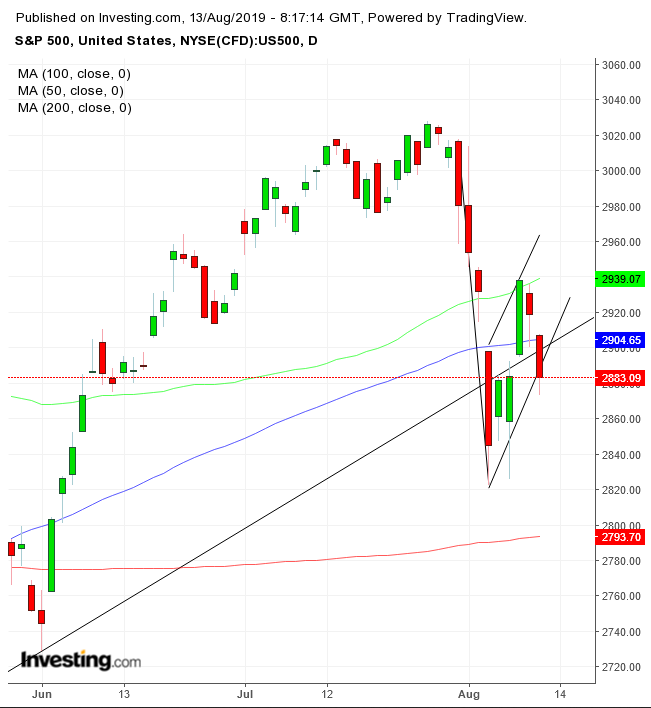
On Monday, the S&P 500 slid 1.23% on risk off, threatening to complete a rising flag, bearish following the index's 6% drop from record highs. The fact that the bearish pattern develops on top of the uptrend line since the December bottom underlines how critical the next move could be, as the uptrend relies on these support levels.
If equities do provide a downside breakout for the flag, they would reinforce a formation of a long-term bearish pattern.
This morning, the yield on 10-year Treasurys dropped to the lowest level since Oct. 2, 2016—as traders weighed the hammer representing last week's support versus a completed pennant continuation pattern—to then rebound slightly. Another leg down for yields would exacerbate selloffs for stocks.

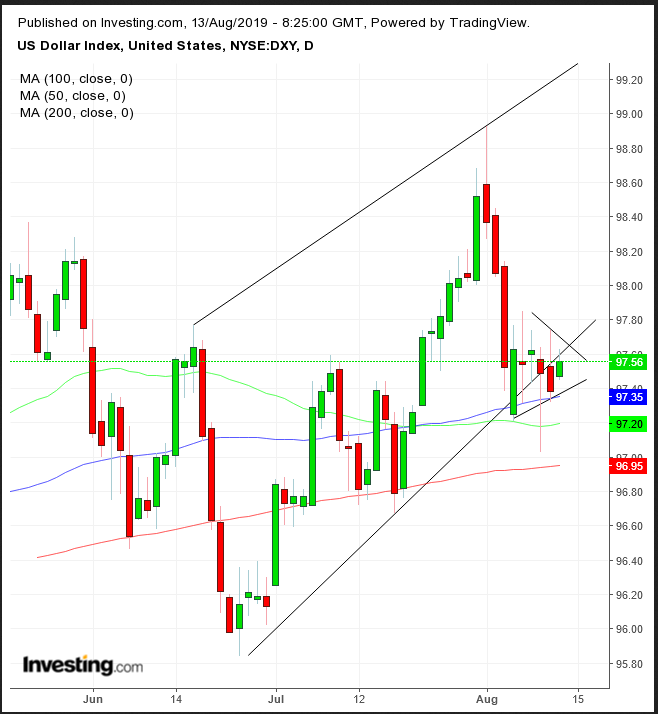
The Dollar Index struggled to return to a rising channel, as it develops a pennant, whose downside breakout would signal another leg down.

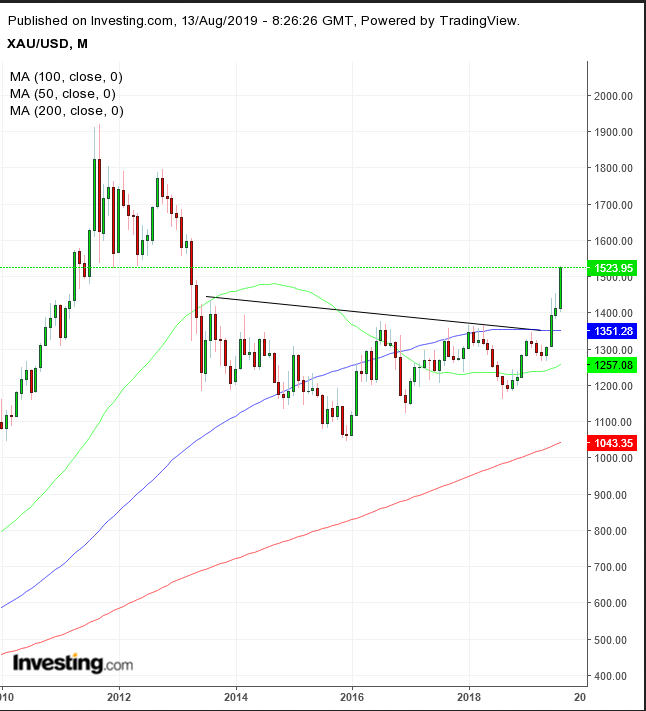
Gold jumped to the highest price since March 2013—even against a strengthening dollar—extending the penetration of an upside breakout to a massive bottom since then.
Bitcoin struggled against the top of a falling channel, consolidating for a week.
Up Ahead
- Companies releasing results include Jd.Com (NASDAQ:JD) and Alibaba (NYSE:BABA), Cisco (NASDAQ:CSCO), the U.K.’s Prudential (LON:PRU), Australia’s Telstra (ASX:TLS), giant retailer Walmart (NYSE:WMT), NVIDIA (NASDAQ:NVDA), Swisscom (SIX:SCMN) and the Danish brewer Carlsberg (CSE:CARLb).
- The U.S. consumer price index, out on Tuesday, is expected to have ticked up to a 1.7% annual pace in July. Core prices, which exclude food and energy, are seen rising 2.1%.
- Fresh data on Chinese retail sales is due for Wednesday, alongside industrial production and the jobless rate.
- Thursday sees the release of U.S. jobless claims, industrial production and retail sales data.
Market Moves
Stocks
- The MSCI Asia Pacific Index fell 1.2%.
- Hong Kong’s Hang Seng slid 1.8%.
Currencies
- The Dollar Index climbed 0.1%8, paring a 0.25% advance.
- The onshore yuan weakened 0.1%.
- The euro dropped 0.2% to $1.1188.
- The Hong Kong dollar advanced less than 0.05% versus the U.S. dollar.
- The British pound slipped 0.3% to $1.2045.
Bonds
- The yield on 10-year Treasurys dropped two basis points to 1.62%.
- Britain’s 10-year yield declined three basis points to 0.463%.
- Germany’s 10-year yield fell two basis points to -0.61%.
- Italy’s 10-year yield slid three basis points to 1.676%.
Commodities
- Gold climbed 0.7% to $1,522.20 an ounce.
- Silver increased 1.8% to $17.37 per ounce.
- West Texas Intermediate crude fell 0.6%.
