- US futures mixed
- European stocks snap 2-day decline after SAP posts positive guidance after coronavirus hit
- China shares continue to outperform, their longest streak since January 2018
- All eyes will be on U.S. weekly Initial Jobless Claims and Continuing Claims, reported later today.
- Singapore holds its general election on Friday.
- Futures on the S&P 500 Index declined 0.2%.
- The Stoxx Europe 600 Index rose 0.4%.
- The U.K.’s FTSE 100 was little changed.
- The MSCI Asia Pacific Index climbed 0.6%.
- The MSCI Emerging Markets Index jumped 1.7% to 1,070.14.
- The Dollar Index was flat at 96.42.
- The euro rose 0.2% to $1.1353.
- The British pound jumped 0.3% to $1.2648.
- The onshore yuan strengthened 0.2% to 6.988 per dollar.
- The Japanese yen was little changed at 107.27 per dollar.
- The yield on 10-year Treasuries slipped one basis point to 0.65%.
- The yield on two-year Treasuries was unchanged at 0.16%.
- Germany’s 10-year yield declined less than one basis point to -0.44%.
- Britain’s 10-year yield fell less than one basis point to 0.181%.
- Japan’s 10-year yield decreased less than one basis point to 0.03%.
- West Texas Intermediate crude declined 0.1% to $40.86 a barrel.
- Brent crude was unchanged at $43.29 a barrel.
- Gold strengthened 0.2% to $1,813.26 an ounce.
Key Events
US futures for the Dow Jones, S&P 500, NASDAQ and Russell 2000 wavered on Thursday, even as European shares headed higher, snapping a two-day losing streak, following a positive Asian session.
This morning's boost was driven by hopes of additional economic support measures ahead of today's virtual meeting between euro area finance ministers. It follows yesterday's UK government announcement of its latest economic rescue plan which would pump 30 billion pounds ($38 million) into the British economy as it reopens. As well, with earnings season approaching, prospects of reassuring corporate news, such as from Germany's SAP this morning, helped fuel market optimism.
The dollar rebounded from a loss, even as yields remained at their lows. Nonetheless, gold reached a nine-year high as coronavirus worries continued to weigh on investors as the global confirmed case count crossed 12 million.
Global Financial Affairs
US futures contracts for the SPX, Dow and Russell 2000 are all down, while NASDAQ futures have been gaining, one day after the tech-heavy index posted a fresh record.
The Stoxx Europe 600 Index rose software giant SAP (DE:SAPG) indicated it was seeing a rebound in its business after the decline caused by pandemic. The German multinational corporation surged 6.5% to a record after confirming its full year outlook. Just the fact that the company was willing—and able—to provide a forecast was positive in and of itself after 80% of S&P 500 stocks didn't provide guidance last quarter.
During the Asian session anticipation that earnings season will confirm an economic recovery fueled gains. China’s Shanghai Composite outperformed for a fourth day, (+1.39). The mainland index notched its the 8th day continuous advance, its longest winning streak since January 2018.
Right now China is enjoying two tailwinds that could be dual catalysts for the exuberance of its local markets. To begin with, it was the first country to effectively emerge from lockdowns and flatten the curve. Second, generous government stimulus along with state media selling the fundamentals of stock ownership helped produce the current powerful rally, albeit one that has the telltale signs of a bubble.
As common investor wisdom posits, when the broader public gets involved in the market, it’s often the beginning of the end.
On Wednesday, US equities advanced during the New York session. Traders continue to consider big tech a sure bet, notwithstanding any geopolitcal health or Sino-US trade risks.
The S&P 500 hit a monthly high and the NASDAQ Composite achieved a fresh record, its 25th for the year, thanks to such mega cap tech stalwarts as Apple (NASDAQ:AAPL) and Amazon (NASDAQ:AMZN).
The problem over the long run, of course, is that a few large caps can’t carry the entire market. This divergence is, in fact, a sign of market weakness.
We can see this divergence on the chart, via the AD section.
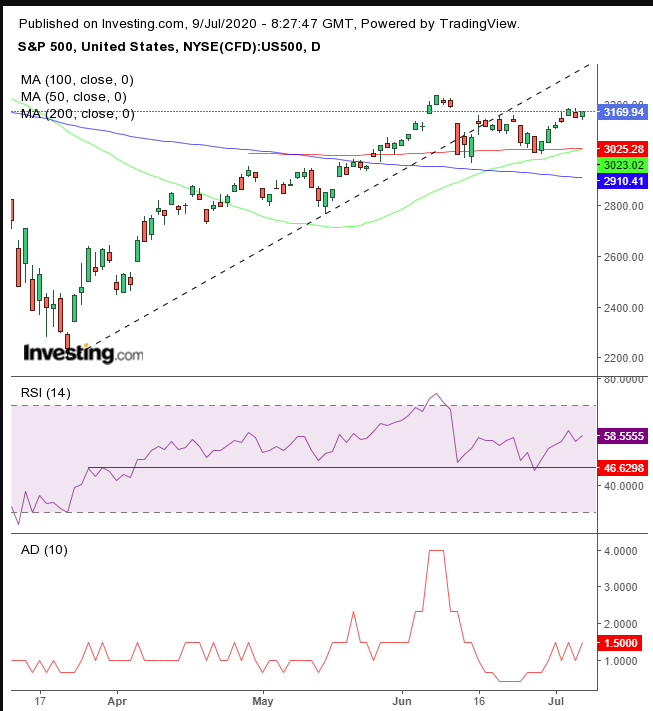
The Advance / Decline measures the number of stocks rallying versus those that are falling. Note how much lower the current read, at 1.5, is versus the over 4 reading registered on June 8. The RSI may be developing a H&S top.
Yields, including for the 10-year Treasury, trimmed yesterday's gains.
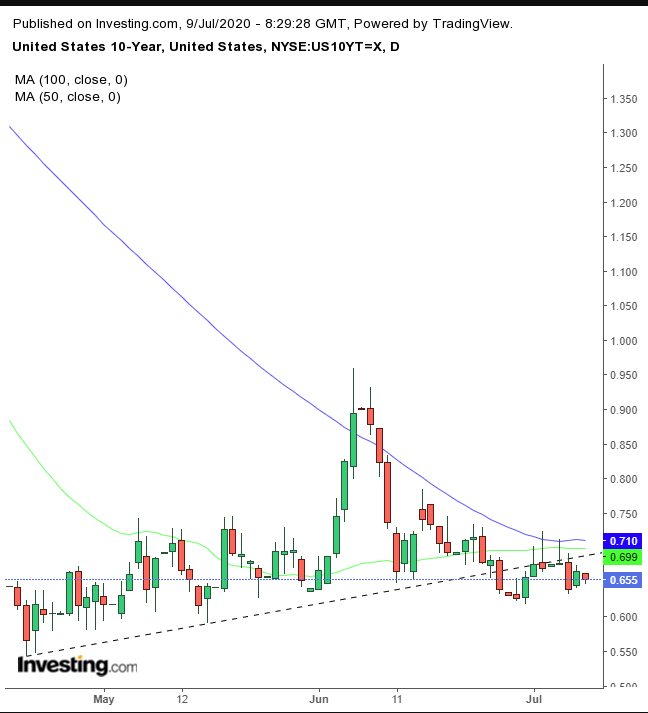
The move confirmed the resistance of the broken uptrend line since April 21, compounded by the joint 50 and 100 DMAs.
The dollar traded off its lows, but still within a second consecutive decline.
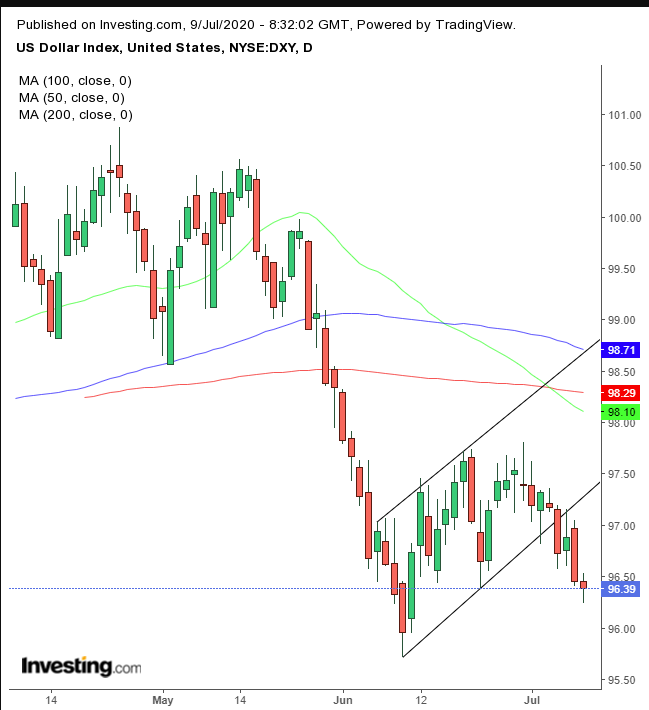
A close at 96.50 or higher would complete a hammer, confirming the support of the June 16 and 24 lows, a potential setup for a return move to test the falling flag. The 50 DMA crossed below a falling 200 DMA, triggering a potent Death Cross, ahead of the flag’s completion.
Gold edged higher, extending an advance to its fourth day in a row as it continues to hold above $1,800, with record high prices in sight.
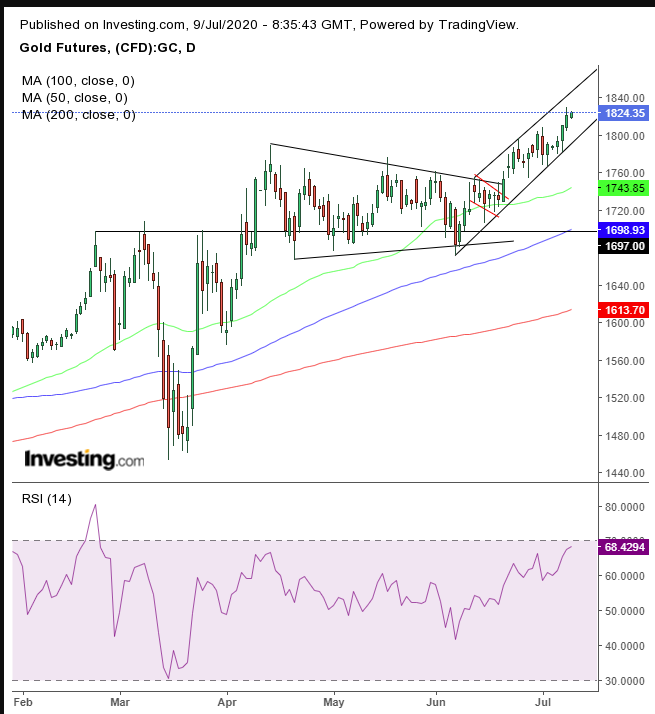
The precious metal has fulfilled the triple bullish pattern: H&S, symmetrical triangle and falling flag. It's currently trading within a rising channel that is too narrow for comfort, which might lead to a corrective dip, as momentum peaks, with the RSI reaching the 70 level.
Oil continues to cling to the $40 level, trading within the same range for over a month. Six issues appear to be whipsawing the price of the commodity.
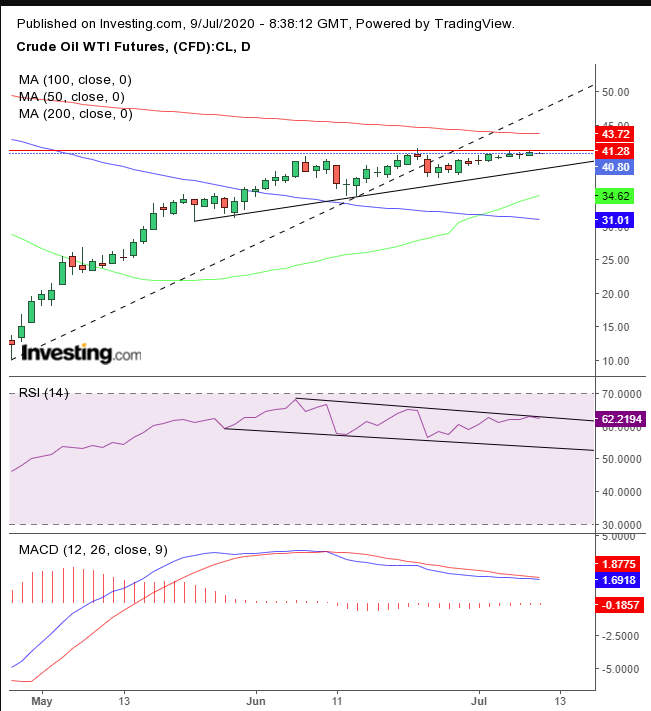
WTI is below the resistance of the March 6 falling flag that wiped out almost a quarter of the commodity’s value. Both the RSI and MACD are providing negative divergences. Oil already broke its uptrend line, but is still within a broader uptrend, with rising peaks and troughs.
