- US administration plans to block Chinese airlines flights
- NASDAQ futures hover near record close
- Gold decouples from dollar, yields
- The European Central Bank is expected to top up its rescue program with an additional 500 billion euros of asset purchases at today's meeting. Anything less than an expansion would be a big shock, Bloomberg Economics said.
- The U.S. labor market report on Friday will probably show that American unemployment soared to 19.5% in May, the highest since the 1930s.
- The Stoxx Europe 600 Index dipped 0.4%.
- NASDAQ futures sank 0.2%.
- The MSCI Asia Pacific Index gained 0.1%.
- The MSCI All-Country World Equity Index fell 0.1%.
- The Dollar Index jumped 0.3%.
- The euro dipped 0.3% to $1.1203.
- The British pound dropped 0.4% to $1.252.
- The Japanese yen weakened 0.2% to 109.08 per dollar.
- The yield on 10-year Treasuries advanced less than one basis point to 0.75%.
- Germany’s 10-year yield climbed one basis point to -0.35%.
- Britain’s 10-year yield fell one basis point to 0.269%.
- Australia’s 10-year yield increased five basis points to 1.0295%.
- West Texas Intermediate crude fell 2.1% to $36.49 a barrel.
- Gold strengthened 0.1% to $1,701.57 an ounce.
- LME nickel dipped 2.5% to $12,550 per metric ton.
Key Events
US futures for the S&P 500, Dow Jones, NASDAQ and Russell 2000 retreated from early gains on Thursday while European shares simply opened lower, as another incident between the US and China spurred traders toward profit-taking.
The Treasury selloff paused, while the dollar jumped. Gold found its footing after a drop. Oil declined.
Global Financial Affairs
What the UK's The Week called, the “worst race riots since the 1960’s” failed to do—pressure markets lower—was accomplished today by an entirely different event, yesterday's threat by the Trump administration to block Chinese airlines from flying to the US. The move is likely to further sour relations between the world’s two largest economies, giving markets pause.
US contracts fell into negative territory. However, after the tech-heavy NASDAQ yesterday grazed its record close of Feb. 19 intraday, closing just 0.05% below, losses on NASDAQ futures are less significant at the time of writing.
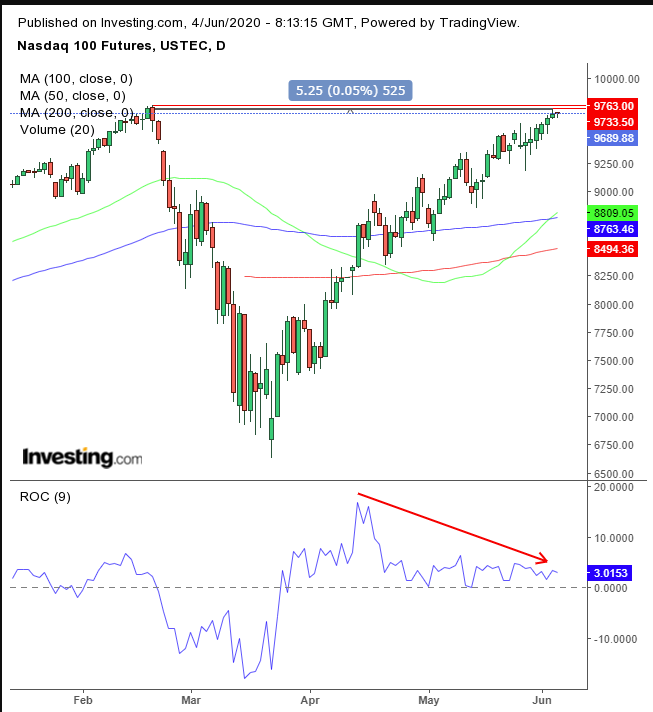
From a technical standpoint, the ROC provides a negative divergence, though it’s interesting to note that its level is the exact same as it was during its record.
The pan-continental STOXX Europe 600 Index opened lower, the first time this week, dragged down by automobile manufacturers and bank shares—ahead of an ECB meeting in which policymakers are expected to inject further aid into the coronavirus-battered eurozone economy. Some regional assets, Italian bonds in particular, have had a bumpy ride ahead of both decisions.
Most Asian indices were in green, with Australia’s ASX 200 gaining, (+0.8%), for the fourth straight session. It outperformed its regional peers, notching a new 3-month high.
China’s Shanghai Composite fell, (-0.1%). Energy stocks weighed on the index as the outlook for oil prices softens. As well, the material sector lagged on flat iron ore prices.
It’s noteworthy, as we've pointed out before, that Chinese indices have generally brushed off negative US-China trade headwinds, even sometimes outperforming regional peers. Today, however, China shares seemed to have taken the geopolitical hit head-on.
Yesterday, banks led the S&P 500 to its highest point in three months—with four stocks gaining for each that fell—boosted by global stocks extending their rally for eight days in a row.
Yields on the 10-year Treasury edged higher, climbing for the fourth straight day.
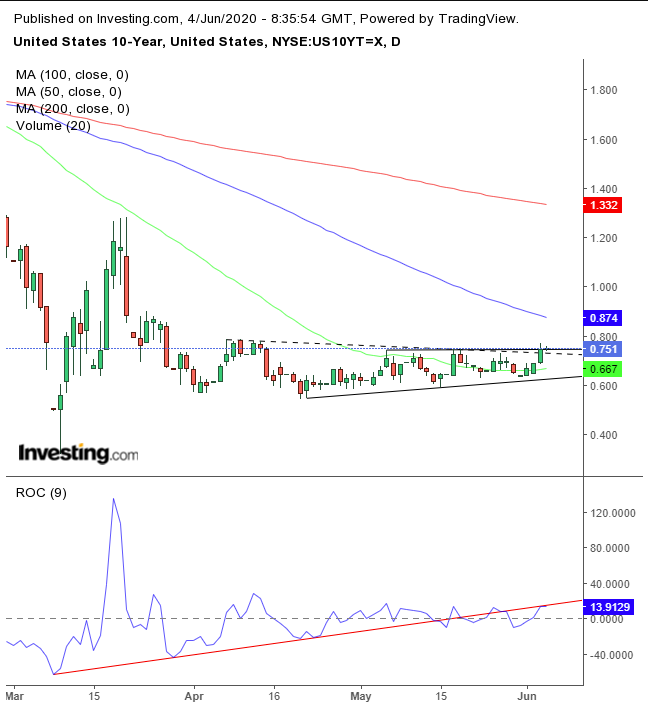
Technically, yesterday, the price climbed above the top of a pattern—either a neutral, symmetrical or bearish, descending triangle. The ROC momentum indicator provided a negative divergence, falling below its uptrend line since May 17. It has now failed for a third time to climb back above it.
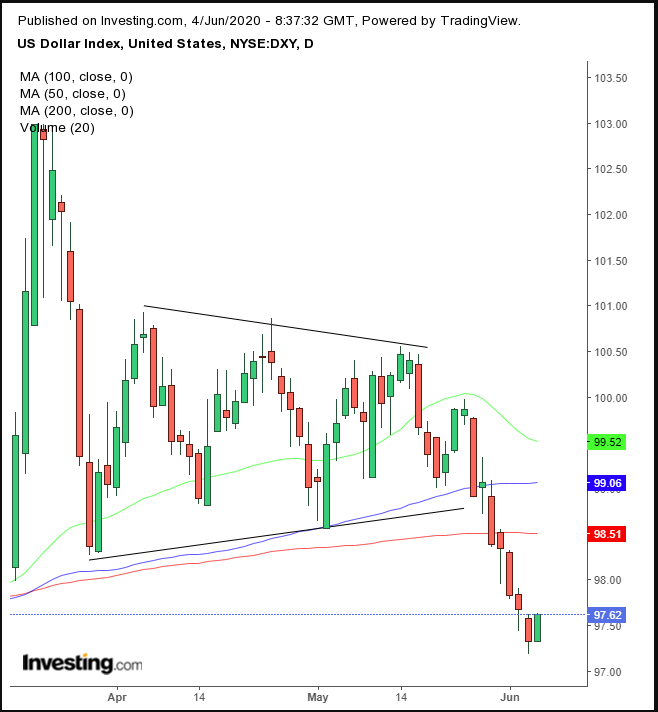
The dollar wiped out yesterday’s losses and added a slight advance after a five-day straight selloff.
Gold seems to have found demand after a two-day slump, presumably on its safe haven status.
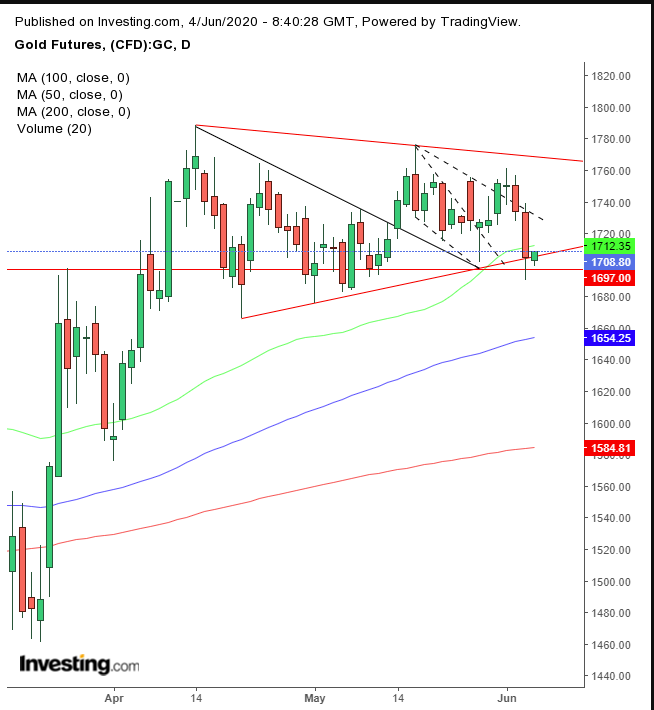
It's been moving in tandem with the dollar—when it would normally do the opposite—due to interest rates. From a technical perspective, the yellow metal is confirming the support of the neckline of a continuation H&S and a symmetrical triangle. However, we’re unsure about the falling flag. The precious metal has also been developing a larger symmetrical triangle.
Oil took a breather after extending itself to a three-month high, likely because the very purpose for the existance of the OPEC+ cartel as a unifying force among oil producers has been threatened by Iraq cheating on oil production. However, the commodity did rally after the Saudis and Russia appeared to agree on extending cuts.
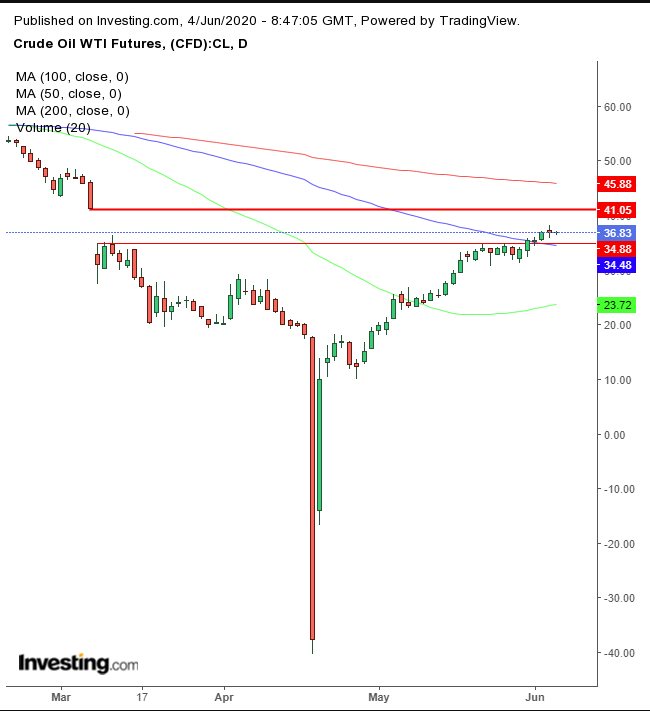
Technically, yesterday’s up and down activity, that resulted in very little change between the open and close, produced a high-wave candle, denoting a market without leadership. The fact that this candle developed within the band of the March 9 giant falling gap further increases the case for a pullback.
