- US futures resume yesterday’s late-session slump
- European stocks open lower
- South Korea's KOSPI enjoys relief rally
- Gold posts highest price in almost 8 years
- The IMF will release new 2020 growth projections on Wednesday.
- U.S. Jobless Claims, Durable Goods Orders and GDP data are due Thursday.
- A rebalance of Russell indexes will occur on Friday.
- The Stoxx Europe 600 Index declined 0.5%.
- Futures on the S&P 500 Index advanced 0.1%.
- NASDAQ futures climbed 0.3%.
- The MSCI Emerging Markets Index increased 0.5%.
- The Dollar Index rose 0.2% to 96.85.
- The euro was little changed at $1.1309.
- The British pound declined 0.1% to $1.2503.
- The Japanese yen weakened 0.1% to 106.60 per dollar.
- New Zealand's dollar dipped 0.5% to $0.6457.
- The yield on 10-year Treasurys climbed one basis point to 0.72%.
- The yield on two-year Treasurys advanced one basis point to 0.19%.
- Germany’s 10-year yield gained two basis points to -0.39%.
- Britain’s 10-year yield climbed one basis point to 0.221%.
- Brent crude increased 0.5% to $42.83 a barrel.
- Gold strengthened 0.1% to $1,770.31 an ounce.
- Iron ore advanced 1.5% to $100.82 per metric ton.
Key Events
US futures for the S&P 500, Dow Jones, NASDAQ and Russell 2000, along with European shares, fell on Wednesday, as mercurial market sentiment flipped, moving away from yesterday's euphoria on stronger-than-expected economic data to today's escalating fears of a global second wave of the COVID-19 pandemic.
Oil slipped, gold gained and the dollar held steady.
Global Financial Affairs
Earlier, contracts on the S&P 500 Index opened lower, but traders briefly collected themselves and managed to push prices into positive territory albeit temporarily. As of this writing all US futures have extended their declines.

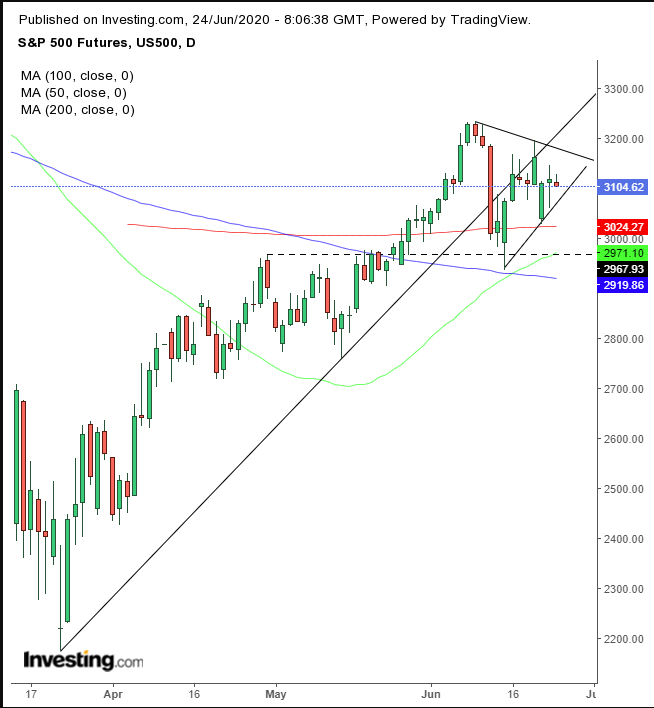
However, from a technical perspective, SPX futures have been developing a pennant, supported by the 200 DMA. An upside breakout would complete this continuation pattern, which would also help the 50 DMA cross above the 200 DMA to trigger a golden cross, perhaps the most well-known bullish signal.
Note: the 100 DMA separates the period of time when the 3,000 level was resistance, from April 30 to May 22, before it became support, as confirmed on May 26, 27 and June 15.
The Stoxx Europe 600 Index fell at the open, after closing at a near 2-week high yesterday. Perhaps more noteworthy, however, defensive stocks underperformed, generally a sign of risk-on.
Asian indices were mixed if not flat, as traders attempted to find the right balance, following another Wall Street rally amid persistently rising COVID-19 cases in both the US and the rest of the world.
South Korea’s KOSPI, (+1.4%), stood out, after North Korean state media said its leader, Kim Jong-un, had "suspended military action" against the southern neighbor. Defense-related shares suffered.
On Wall Street yesterday, stocks climbed for the second day but gave up session highs on reports of rising coronavirus cases, which have now topped 9.2 million worldwide. Affected countries are now debating re-instituting lockdowns, which could limit the much-focused-upon economic restart.
The S&P 500 advanced 0.4%, trimming a 1.2% intraday high. The NASDAQ Composite notched yet another a fresh all-time high.
Yields, including for the US 10-year Treasury, were flat, after they gave back a modest rally.
In the aftermath of a two-day selloff, the dollar found its footing.

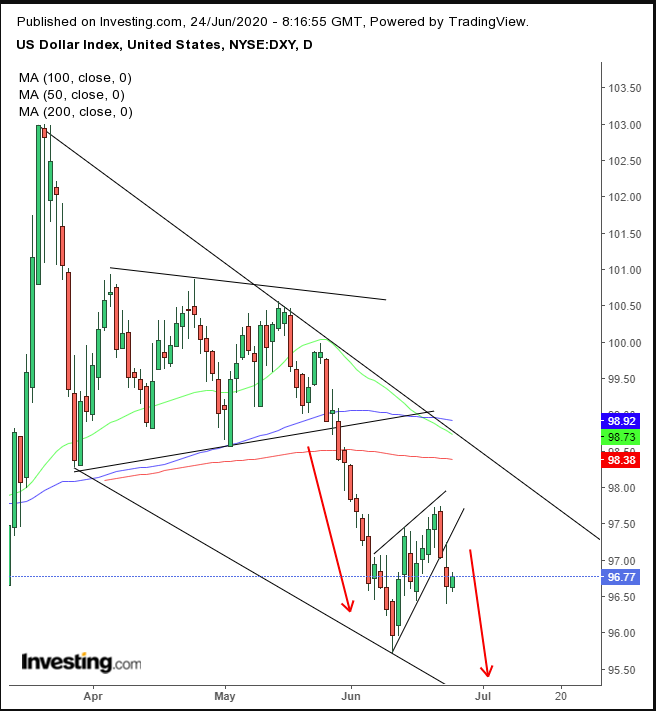
From a technical perspective, the USD provided a downside breakout to a rising flag, bearish after the 4.3% plunge in just over two weeks.
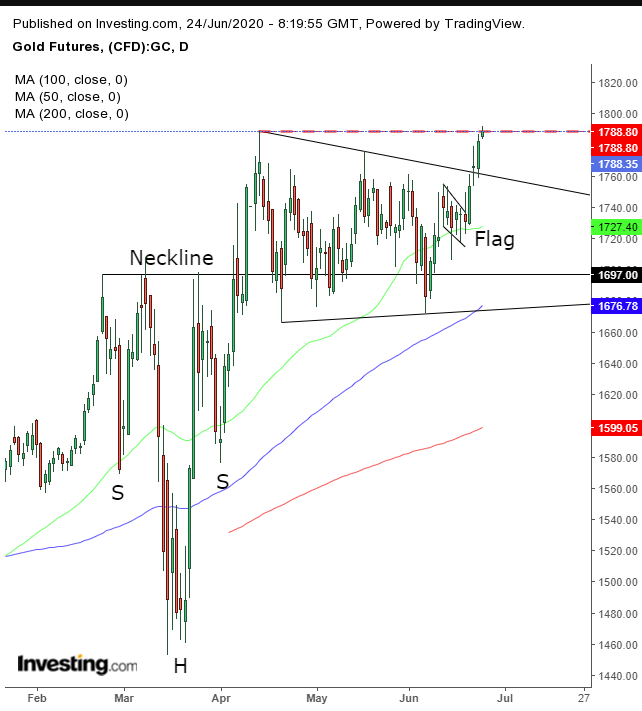
Gold, having reached its highest levels since 2012 on a backdrop of dollar weakness, is in focus.

Since the dollar is expected to head lower, the yellow metal is on a path to retest record highs, having broken free of a range. Just beware a pullback before the journey toward all time highs commences.
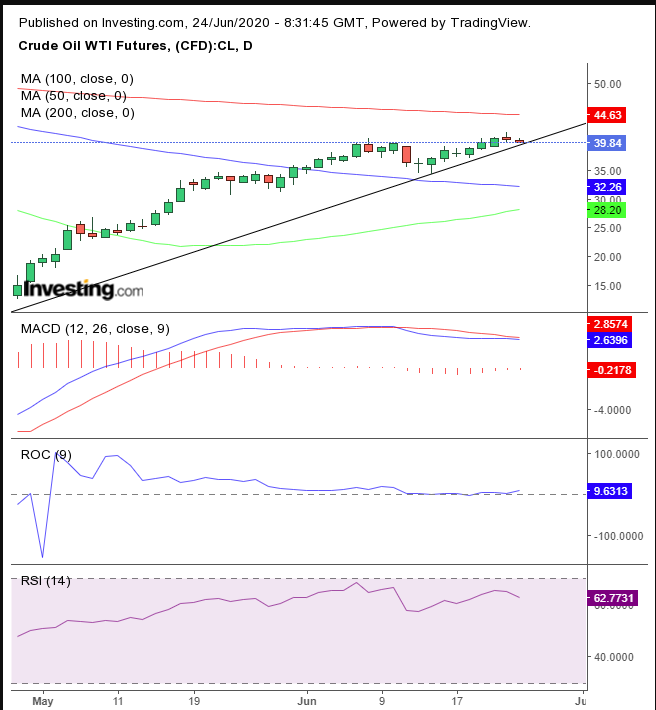
Oil is falling for a second day. It has slipped below $40, after having closed above that mark for the past two days, a level it hadn't hit since March 6.

However, WTI's advances have been growing weaker, as can be seen via momentum indicators. The MACD has also provided a sell signal.
