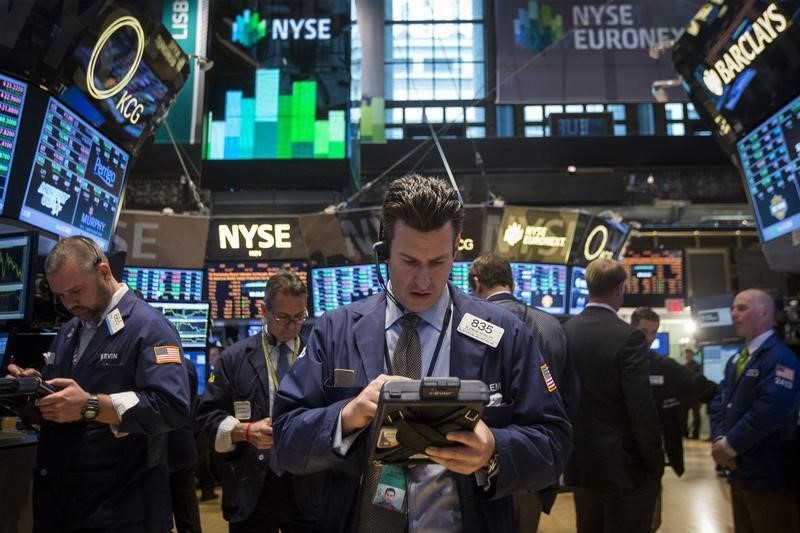
Investing.com – U.S. equities were lower at the close on Friday, as losses in the Technology, Consumer Services and Healthcare sectors propelled shares lower.
At the close in NYSE, the Dow Jones Industrial Average lost 1.02% to hit a new 1-month low, while the S&P 500 index declined 1.05%, and the NASDAQ Composite index fell 1.69%.
The biggest gainers of the session on the Dow Jones Industrial Average were Dow Inc (NYSE:DOW), which rose 1.05% or 0.60 points to trade at 57.79 at the close. JPMorgan Chase & Co (NYSE:JPM) added 0.90% or 1.26 points to end at 140.93 and Verizon Communications Inc (NYSE:VZ) was up 0.55% or 0.21 points to 38.74 in late trade.
Biggest losers included Boeing Co (NYSE:BA), which lost 4.80% or 9.98 points to trade at 198.15 in late trade. Microsoft Corporation (NASDAQ:MSFT) declined 2.18% or 5.55 points to end at 249.22 and Intel Corporation (NASDAQ:INTC) shed 1.84% or 0.47 points to 25.14.
The top performers on the S&P 500 were Linde PLC (NYSE:LIN) which rose 4.75% to 347.64, Edison International (NYSE:EIX) which was up 4.21% to settle at 68.63 and Coterra Energy Inc (NYSE:CTRA) which gained 3.61% to close at 25.56.
The worst performers were Autodesk Inc (NASDAQ:ADSK) which was down 12.95% to 192.53 in late trade, Live Nation Entertainment Inc (NYSE:LYV) which lost 10.08% to settle at 68.78 and Adobe Systems Incorporated (NASDAQ:ADBE) which was down 7.63% to 320.54 at the close.
The top performers on the NASDAQ Composite were Bridger Aerospace Group Holdings Inc (NASDAQ:BAER) which rose 78.73% to 7.90, Cyren Ltd (NASDAQ:CYRN) which was up 61.90% to settle at 0.34 and Connexa Sports Technologies Inc (NASDAQ:CNXA) which gained 49.43% to close at 0.21.
The worst performers were Fulcrum Therapeutics Inc (NASDAQ:FULC) which was down 56.09% to 5.66 in late trade, Sellas Life Sciences Group Inc (NASDAQ:SLS) which lost 53.66% to settle at 1.71 and ObsEva SA (NASDAQ:OBSV) which was down 50.77% to 0.08 at the close.
Declining stocks outnumbered rising ones by 2156 to 869 and 98 ended unchanged; on the Nasdaq Stock Exchange, 2732 fell and 918 advanced, while 168 ended unchanged on the New York Stock Exchange.
The CBOE Volatility Index, which measures the implied volatility of S&P 500 options, was up 2.51% to 21.67.
In commodities trading, Gold Futures for April delivery was down 0.47% or 8.55 to $1,818.25 a troy ounce. Meanwhile, Crude oil for delivery in April rose 1.53% or 1.15 to hit $76.54 a barrel, while the April Brent oil contract rose 1.35% or 1.11 to trade at $83.32 a barrel.
EUR/USD was unchanged 0.43% to 1.05, while USD/JPY rose 1.28% to 136.43.
The US Dollar Index Futures was up 0.61% at 105.17.
