By Shinichi Saoshiro and Andrew Galbraith
TOKYO/SHANGHAI (Reuters) - Asian stocks were set to end the month up from 20-month lows on Wednesday amid pledges by China to support its domestic markets, but sentiment was fragile after equity markets bled trillions of dollars in a grim October.
A confluence of factors from Sino-U.S. trade tensions to worries about U.S. corporate earnings to the end of easy money in development economies have spurred volatility in financial markets in the past few weeks.
MSCI's broadest index of Asia-Pacific shares outside Japan (MIAPJ0000PUS) was 1 percent higher on Wednesday afternoon, drawing support from gains on Wall Street overnight. Yet, it was on track to fall around 11 percent this month, which would be its worst monthly performance since September 2011.
The index had dropped to its lowest level since February 2017 on Monday as worries over corporate profits weighed heavily on U.S. equities.
Wall Street's three stock indexes had jumped more than 1 percent on Tuesday, helped by strong gains for chip and transport stocks as investors took advantage of cheaper prices following the steep recent pullback for equities. (N)
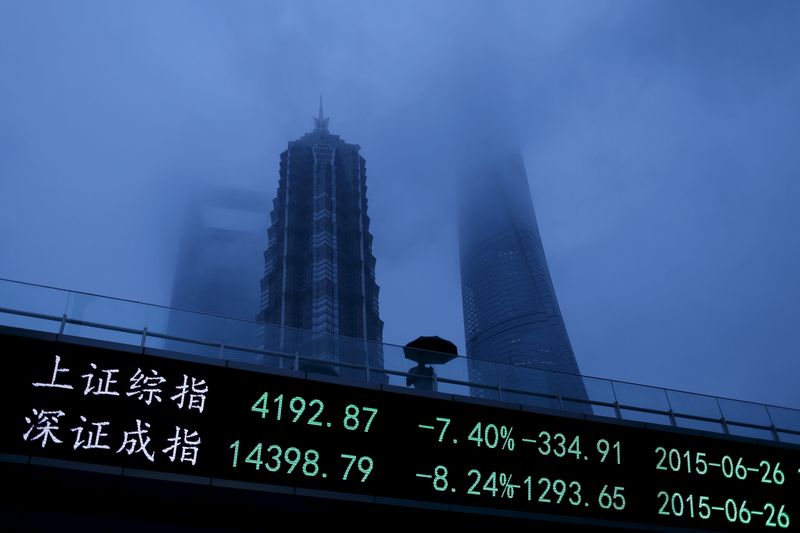
Hong Kong's Hang Seng (HSI) rose 0.84 percent on Wednesday and the Shanghai Composite Index (SSEC) climbed 1 percent, with gains reflecting investor optimism about policymakers' pledges of support despite weak factory activity data for this month.
Australian stocks (AXJO) ended 0.43 percent higher, South Korea's KOSPI (KS11) rose 0.69 percent and Japan's Nikkei (N225) advanced 2 percent, reassured by the Bank of Japan's signal to keep its ultra-easy policy for some time to come.
"The recent slide in equities had gone to such an extent that it was bound to invite buyers, such as in the Japanese stock market," said Masahiro Ichikawa, senior strategist at Sumitomo Mitsui Asset Management in Tokyo.
The MSCI AC World (MIWD00000PUS) index, which includes a few large emerging markets in addition to developed markets, was down 8.6 percent this month and has lost about $4 trillion in value. The narrower MSCI World Index was down 8.5 percent and has wiped out $4.5 trillion in October. For graphic on MSCI World and Asia Indices, click https://tmsnrt.rs/2P1xKze
Ichikawa at Sumitomo Mitsui Asset Management said the outlook for markets was still cloudy, adding that the U.S.-China trade row will "likely to remain a factor of concern beyond the U.S. midterm elections."
U.S. President Donald Trump said during an interview with Fox News late on Monday that he thought there could be an agreement with China on trade. But he also said he had billions of dollars worth of new tariffs ready to be imposed if a deal was not possible.
In currencies, the dollar index against a basket of six major currencies extended overnight gains and was near a 16-month peak of 97.054 (DXY) after data on Tuesday showed U.S. consumer confidence rose to an 18-year high in October, suggesting strong economic growth could persist in the near term.
The dollar traded near three-week highs against the yen following the BOJ's decision to hold fire on rates. At around 0540 GMT, one greenback cost 113.28 yen <JPY=>.
The euro was down 0.04 percent to $1.1339 (EUR=) after losing 0.25 percent the previous day. A dip below $1.1336 would take the single currency to its lowest since mid-August.
China's yuan was flat at 6.9670 per dollar in onshore trade <CNY=CFXS> but remained near a decade low of 6.9724 brushed on Tuesday.
The yuan has been pressured by worries about slowing Chinese economic growth and a potential sharp escalation in the U.S.-China trade war. New data released Wednesdsay showed China's manufacturing sector expanded at its weakest pace in more than two years in October, and showed a deepening slump in export orders.
The Australian dollar was down 0.2 percent at $0.7091 <AUD=D3>, weighed by soft domestic inflation data. The lacklustre October China factory growth data was also a drag on the Aussie.
Oil prices recovered slightly after dropping to multi-month lows the previous day on signs of rising supply and concern that global economic growth and demand for fuel will fall victim to the U.S.-China trade war. [O/R]
U.S. crude futures (CLc1) were up 0.51 percent at $66.52 per barrel after dropping to $65.33 on Tuesday, their lowest since mid-August.

Brent crude (LCOc1) gained 0.63 percent to $76.39 per barrel after a decline of 1.8 percent on Tuesday.