- WHO warns of coronavirus acceleration and US markets dive
- Florida and North Carolina set new, single day records for COVID-19 outbreaks
- Record US Retail Sales and upcoming US data may indicate that the worst of the economic contraction is behind us
Though US stocks gained for the week, driven largely by wildly better-than-expected economic data, three of the four major Wall Street indices—the Dow Jones, S&P 500 and Russell 2000—sold off on Friday; the NASDAQ barely scraped out an increase. Friday's selloff was the worst in over a week as the path to restarting the economy once again veered off course, and yet again seemed to curve out of view.
Though the S&P 500 opened 0.8% higher on Friday, the broad benchmark gave back that advance—and then some—after the World Health Organization indicated that COVID-19 is still malignant and has accelerated. To date more than 8,770,000 cases have been reported worldwide, with 464,039 fatalities.
Key Oppositional Market Drivers, Looming Geopolitical Risks
Though the SPX closed down 0.6% ahead of the weekend, traders can at least attempt to find some consolation in the fact that most of the decline was driven by Utilities, (2.8%). At least that allows them to tell themselves the market may still be prone to risk.
The second worst performing sector, Energy, (-1.5%), was pressured by Equitrans Midstream (NYSE:ETRN) whose shares slumped 7.37% on Friday, even after the Federal Regulatory Commission approved the company’s planned 75-mile extension of its Mountain Valley Pipeline between Chatham VA and Greensboro NC on Thursday. This looks to us like a case of buying the rumor and selling the news.
Healthcare was the only sector in the green, (+1%). Investors anticipate healthcare firms will be increasing premiums once patients resume having elective medical procedures. The sector has transitioned from defensive to risk in the past six months.
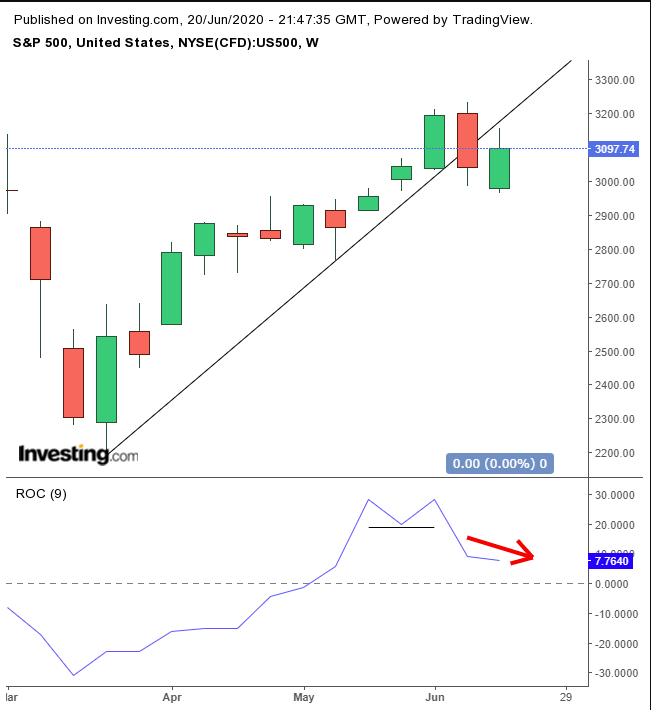
While the S&P 500 may have climbed for the week, it could be a shorting opportunity for technicians, after a Dark Cloud cover—a two-session bearish Japanese Candlestick pattern—followed by a retest that found resistance both by the pattern top and the broken uptrend line since the March low. The ROC provided a negative divergence, falling against the rising index, which followed the momentum indicator’s double top.
The Dow notched its third straight drop and the fourth day in which it failed to pass the 200 DMA. The mega-cap index was dragged down by Apple (NASDAQ:AAPL)—which currently has a 9.25% weighting on the Dow—after the iPhone maker said it would close some of its stores amid the escalation in coronavirus cases, increasing worries of another lockdown.
Although the VIX popped on Friday—unwinding some of the sense of upcoming stability communicated by the three previous sessions—it was still slightly lower for the week. This suggests there remains a lingering stalemate between the two key, oppositional market drivers: concerns over a second wave of the coronavirus versus historically unparalleled stimulus levels.
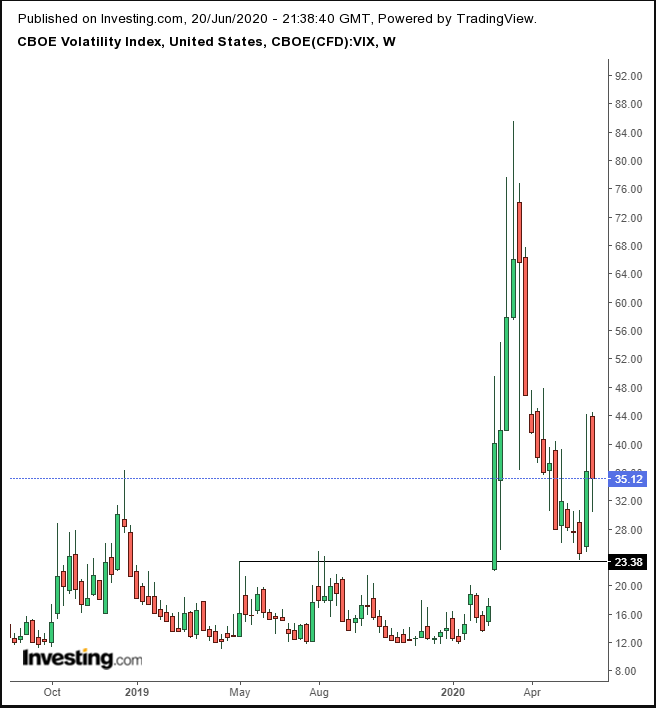
Technically, the VIX found support above its weekly highs since early May.
Over the course of the week, US stocks moved higher, boosted by promising economic data. Retail Sales surged almost 18% in May, the biggest monthly increase ever. This could, of course, be signaling that the largest economy in the world is improving from depressed levels. However, investors also pushed stocks higher based on unprecedented levels of stimulus.
We're seeing an inherent contradiction building. If economic growth is picking up, then there would be no need for the Fed's never-ending liquidity, along with governmental largesse. Conversely, if the US economy is in need of such a massive amount of support, perhaps the data is being distorted by the unlimited QE, meaning it isn’t reflecting a true picture of the country's economy.
Of course, it’s possible that the unprecedented monetary and fiscal support is, in fact, what is creating an economic rebound, which could take on a life of its own, in a natural, healthy and sustainable way. But then, we have the concerns of a second wave of COVID-19.
As well, don't forget there are additional geopolitical risks that continue lurking in the shadows: it's an election year, at a time when the US may just be the most polarized its perhaps ever been; trade tensions continue brewing, even if China's pledge to buy an additional $200 billion worth of US agricultural products was just reiterated this past week when US and China officials met in Hawaii; North Korea’s ongoing bellicose antics; Sino-Indian border aggression; Brexit; sanctions versus Iran and its disruptions in the oil market. That's a lot of uncertainty.
Treasury yields slipped on Friday after the WHO's report was released.
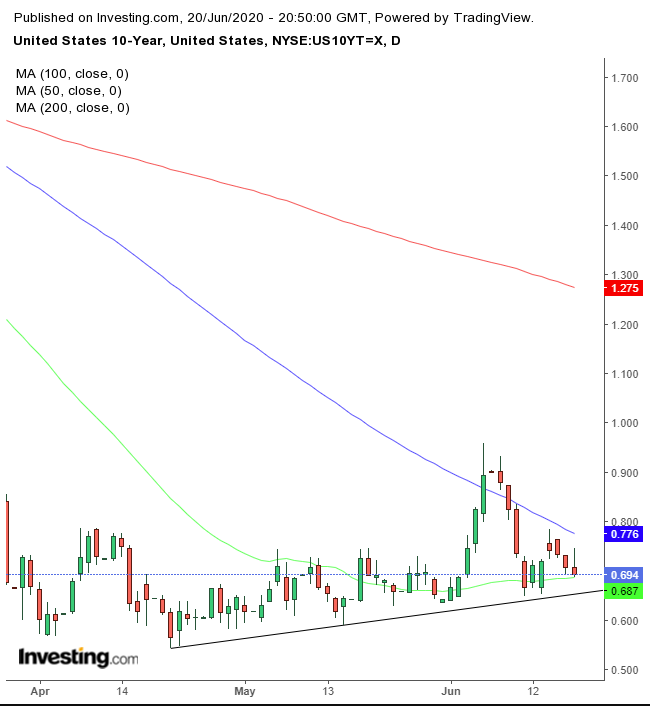
Yields on the 10-year note fell for three straight days, dropping since Tuesday’s jump, finding resistance by the 100 DMA. The 50 DMA has almost entirely become the support since it was crossed on May 18.
Advances on Monday and Tuesday—especially the higher open which occurred on the latter day—put yields higher for the week, even though investors started rolling out of risk as the week progressed, the same time during which stocks declined.
The dollar recorded only a small weekly gain, fueled by safe haven demand.
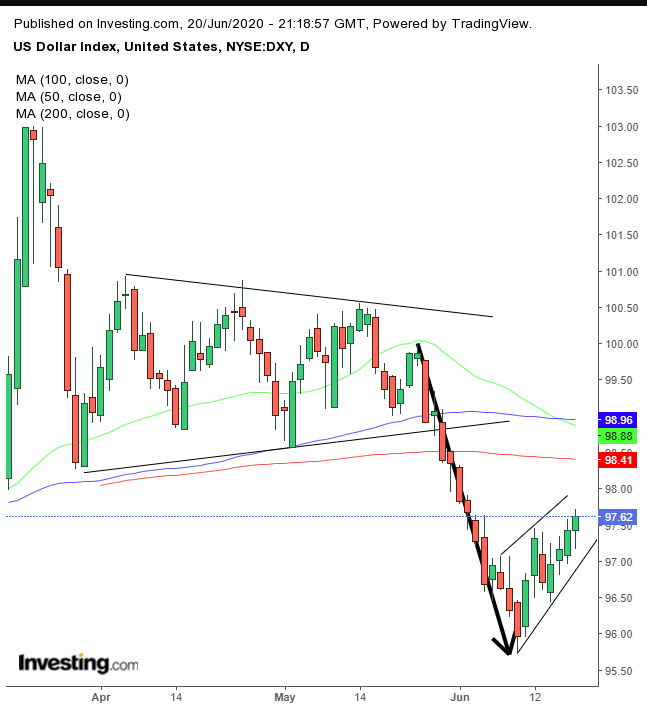
Still, the moves higher followed a bullish weekly hammer. It was also the third week that successfully retested the support of the 200-week MA. As such, we think the risk for the USD is to the downside.
The daily chart is developing a tightly-woven, rising flag, following a 4% plunge in 12 sessions, which completed a bearish, symmetrical pattern. The bottom of the pattern realigned with both the 100 and 200 DMA signifying it's a major technical pressure point. Meanwhile, the 50 DMA crossed below the 100 DMA, showing that average prices are falling, even as the dollar has been strengthening on a daily basis.
The safe haven yen also gained on Friday, for the third straight day, rising for the second week in a row.
Gold also jumped, along with the number of reported cases of coronavirus, and analysts for Goldman Sachs increased their 12-month price target by 11%, to $2,000 an ounce.
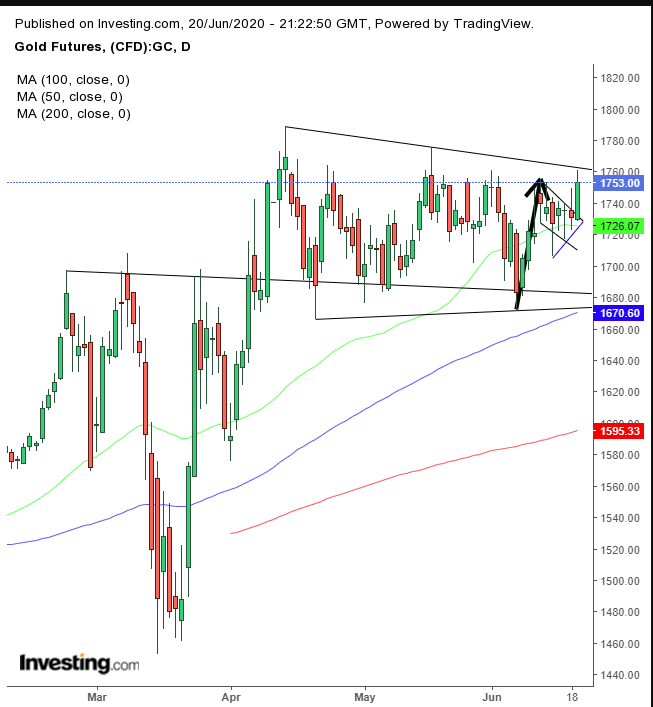
On Friday, the precious metal surged 1.3%, even against the weight of a stronger US dollar. The price completed a falling flag or a pennant, either of which is bullish after the yellow metal's 4.1% leap in just the four days preceding pattern.
That pause may be what was necessary for the precious metal to break through the symmetrical triangle since the H&S breakout in early April. That's when some bulls took early profits, giving a set of new traders a chance to take on the $1,760 price level that bears would presumably defend, at the top of the pattern.
Oil jumped 2.3% on Friday. The move was triggered by supply cut expectations rather than the fear across broader markets that new lockdowns could be looming.
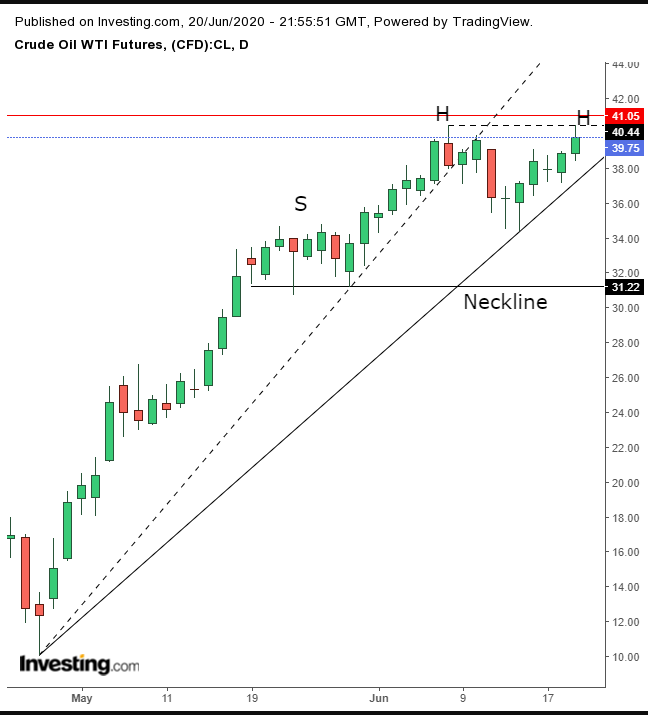
It was the second straight day of up-moves for the commodity, which gained a cumulative 4.8%, to reach its highest point—on both an intraday and closing basis—since March 6.
This made it the seventh week of advances for WTI, out of eight. The penetration beyond the June 8 high warranted the redrawing of a new uptrend line. However, the price closed off its high, possibly meeting the same supply that was waiting on June 8, above the $40 level. This would jibe with the presumed resistance at the top of the March 9 falling gap (red line), and may be the catalyst for another dip to the June 15 low of $34.36.
If that doesn’t hold, then the $31 levels would be next, the lows of May 19-28, still keeping a H&S top in play.
The Week Ahead
All times listed are EDT
Sunday
21:30: China – PboC Loan Prime Rate: previous rate was 3.85%.
Monday
10:00: US – Existing Home Sales: expected to print at 4.10 M, down from 4.33M last month.
Tuesday
3:30: Germany – Manufacturing PMI: seen to jump to 41.5 from the low of 36.6 previously.
4:30: UK – Manufacturing and Services PMI: the former expected to come in at 43.8, up from 40.7; the latter to come in at 40.5, from the 29.0 last month.
10:00: US – New Home Sales: probably edged higher to 640K from 623K.
22:00: New Zealand – RBNZ Interest Rate Decision: forecast to remain steady at 0.25%.
Wednesday
4:00: Germany – Ifo Business Climate: to rise to 85.0 from 79.5.
10:30: US – Crude Oil Inventories: anticipated to plunge to -0.152M from 1.215M.
Thursday
China and Hong Kong closed for holidays
8:30: US – Core Durable Goods Orders: forecast to jump to 2.1%, rebounding from -7.7%.
8:30: US – GDP: predicted to have remained flat during Q1 at -5.0%
8:30: US – Initial Jobless Claims: last week's figure came in a bit worse than expected at 1,508K.
Friday
8:30: US – Personal Spending: expected to have vaulted to 9.0% from an abysmal -13.6%.
