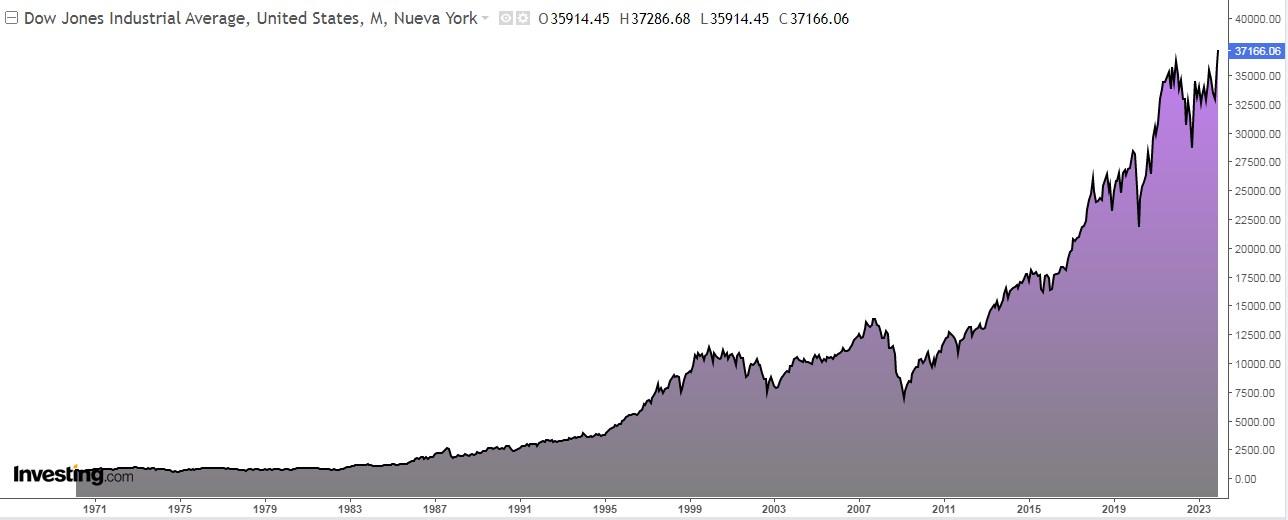
- Recently, Dow Jones achieved its 11th consecutive year of new all-time highs, surpassing the 1989-2000 record.
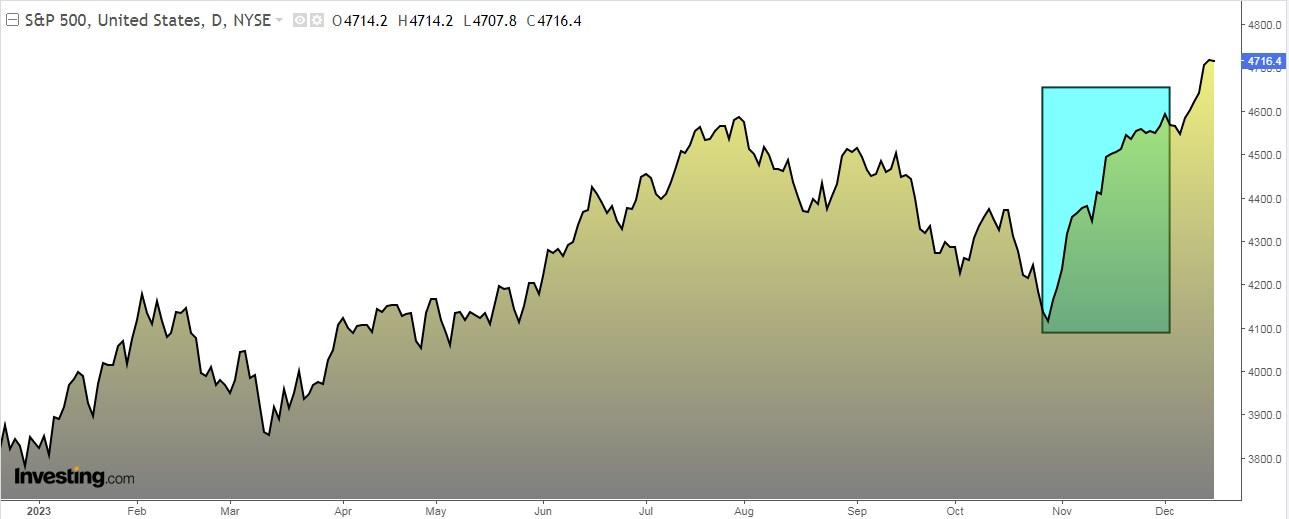
- Meanwhile, over 60% of stocks listed in the S&P 500 reached new 20-day highs - a rare event with historically positive implications.
- Moreover, bullish sentiment has reached 51.3%, the highest since July 20, 2023, while bearish sentiment has dropped to 19.3%, the lowest since January 3, 2018.
- Year 2017: 71
- Year 1995: 69
- Year 1925: 65
- Year 1964: 62
- Year 1928: 58
- Year 2017: +74.8%
- Year 2012: +84.3%
- Year 2003: +97%
- Nasdaq +41.54%.
- Nikkei Japanese +26.35%.
- S&P 500 +22.91%.
- Ibex 35 Spanish +22.68%
- Dax +20.31%
- Euro Stoxx 50 +19.92%
- Cac +17.35%
- Dow Jones +12.54%
- FTSE 100 British +1.67%
On December 13, the Dow Jones Industrial Average accomplished a remarkable feat by reaching a new all-time high, marking the first time since early January 2022.
This achievement signifies the extension of the Dow Jones' streak of consecutive years with at least one all-time high to 11.
The previous record streak spanned from 1989 to 2000, during which it recorded 12 consecutive years with at least one all-time high.

The years with the most all-time highs were:
In the last 129 years, in total, there were 55 years in which it achieved at least 1 all-time high and the other 74 occasions it did not.
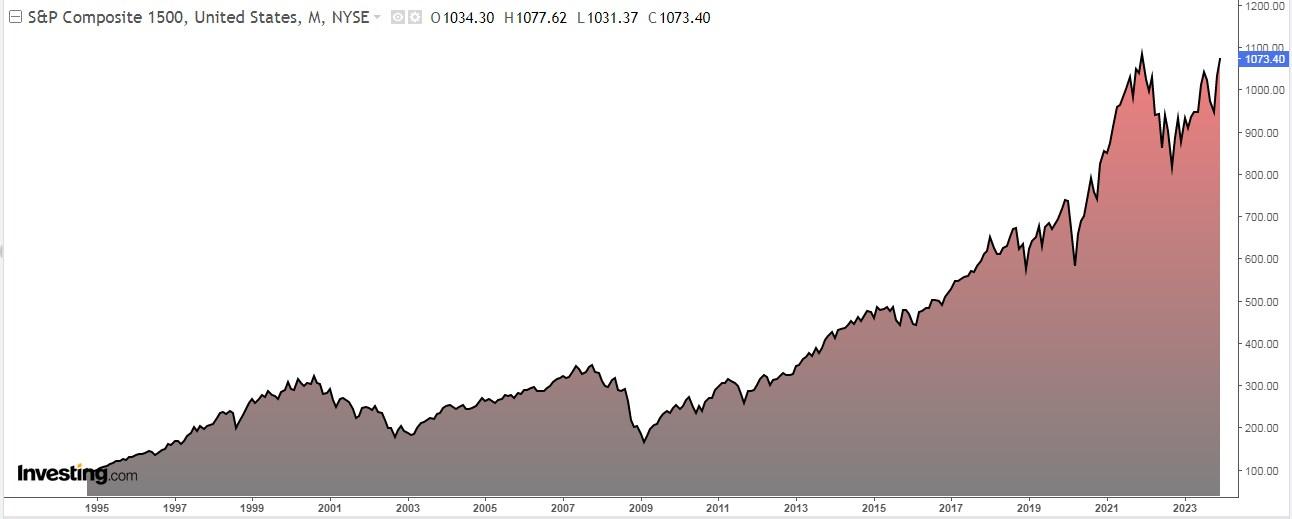
S&P 1500's Fourth-Best Year in History
The S&P Composite 1500 is a U.S. index that includes all the stocks in the S&P 500, S&P 400 and S&P 600 and covers 90% of the market capitalization of the country's stocks.

Well, it is up more than +62% for the year, which means it is its best year in the last 28 years.
The 3 years better than the current one are:
S&P 500: Bullish 2024 Is in the Offing
The significance of the current situation lies in the fact that over 60% of all S&P 500 stocks have reached new 20-day highs. Such occurrences are rare, having only happened 15 times in the last 51 years.
Historically, the S&P 500 has consistently responded positively to this pattern, recording an upward movement one year later on all 15 occasions, with an average return of approximately +18%. 
But that's not all. As it turns out, the S&P 500 blew out last November by +8.9%, its 18th best month ever. Well, history shows us that if we take every month in which the S&P 500 has risen more than +8%, the index a year later had risen virtually every time.
Stock market rankings
This is the ranking of the world's major stock exchanges so far in 2023:
Investor sentiment (AAII)
Bullish sentiment, i.e. expectations that stock prices will rise over the next six months, increased 4 percentage points to 51.3%. It is at its highest level since July 20, 2023 (51.4%) and remains above its historical average of 37.5%.
Bearish sentiment, i.e., expectations that stock prices will fall over the next six months, decreased 8.1 percentage points to 19.3%. It is at its lowest level since January 3, 2018 (15.6%) and remains below its historical average of 31%.
***
You can easily determine whether a company is suitable for your risk profile by conducting a detailed fundamental analysis on InvestingPro according to your criteria. This way, you will get highly professional help in shaping your portfolio.
In addition, you can sign up for InvestingPro, one of the most comprehensive platforms in the market for portfolio management and fundamental analysis, much cheaper with the biggest discount of the year (up to 60%), by taking advantage of our extended Cyber Monday deal.
Disclaimer: This article is written for informational purposes only; it does not constitute a solicitation, offer, advice, or recommendation to invest as such it is not intended to incentivize the purchase of assets in any way. I would like to remind you that any type of asset, is evaluated from multiple points of view and is highly risky and therefore, any investment decision and the associated risk remains with the investor.

