Looking for steady income? Preferred stocks are one of many instrument types that can help.
Today, we will look at the characteristics of preferred stocks and two exchange-traded funds (ETFs) to gain exposure.
It is important to note that preferred securities may have different characteristics in different countries. Our discussion centers around those issued in the US.
Preferred Stock: Advantages And Drawbacks
Preferred shares have characteristics of bonds, which pay a fixed income and stocks, which represent ownership in a company. Holders, who typically buy them for income and not necessarily growth, are entitled to dividend payments on a set schedule, which resemble bond interest payments.
The banking sector is currently the largest segment of the preferred universe in the US as many banks issued preferred stocks following the subprime crisis and the economic contraction over a decade ago. This is one of the best ways for banks to meet the higher capital requirements imposed by regulators.
While company earnings do not have much effect on the price of preferred stocks, interest rates and credit ratings are important factors.
In bankruptcy and liquidation, preferred stockholders have priority over common stockholders. This higher claim on a company's assets is part of the reason for the term "preferred."
But they stand behind creditors, so preferred shareholders get paid only if there is money left after all senior creditors have been paid off. Due to this subordination risk, preferred stocks pay higher rates than the same corporate entity's bonds.
Another reason for the higher dividend rate: preferred stocks are callable, so although preferred stocks would not have a maturity date, they are typically issued with a five-year call provision. If interest rates fall, the preferred stocks could trade at a premium and could easily be called (redeemed) by the issuer at par.
For instance, if the callable preferred shares on the market have a 5% dividend when interest rates fall to 1%, the issuer can purchase outstanding shares. Then it reissues new preferred stocks at a lower dividend rate. Such a move helps the business decrease the cost of capital. However, the original shareholder is disadvantaged.
On a final note, there may be some tax benefits to preferred stock dividends for US-based investors, who may want to consult their accountants or financial advisors.
With that in mind, here are two preferred stock ETFs that enable investors to buy a portfolio of preferred shares:
1. Invesco Preferred ETF
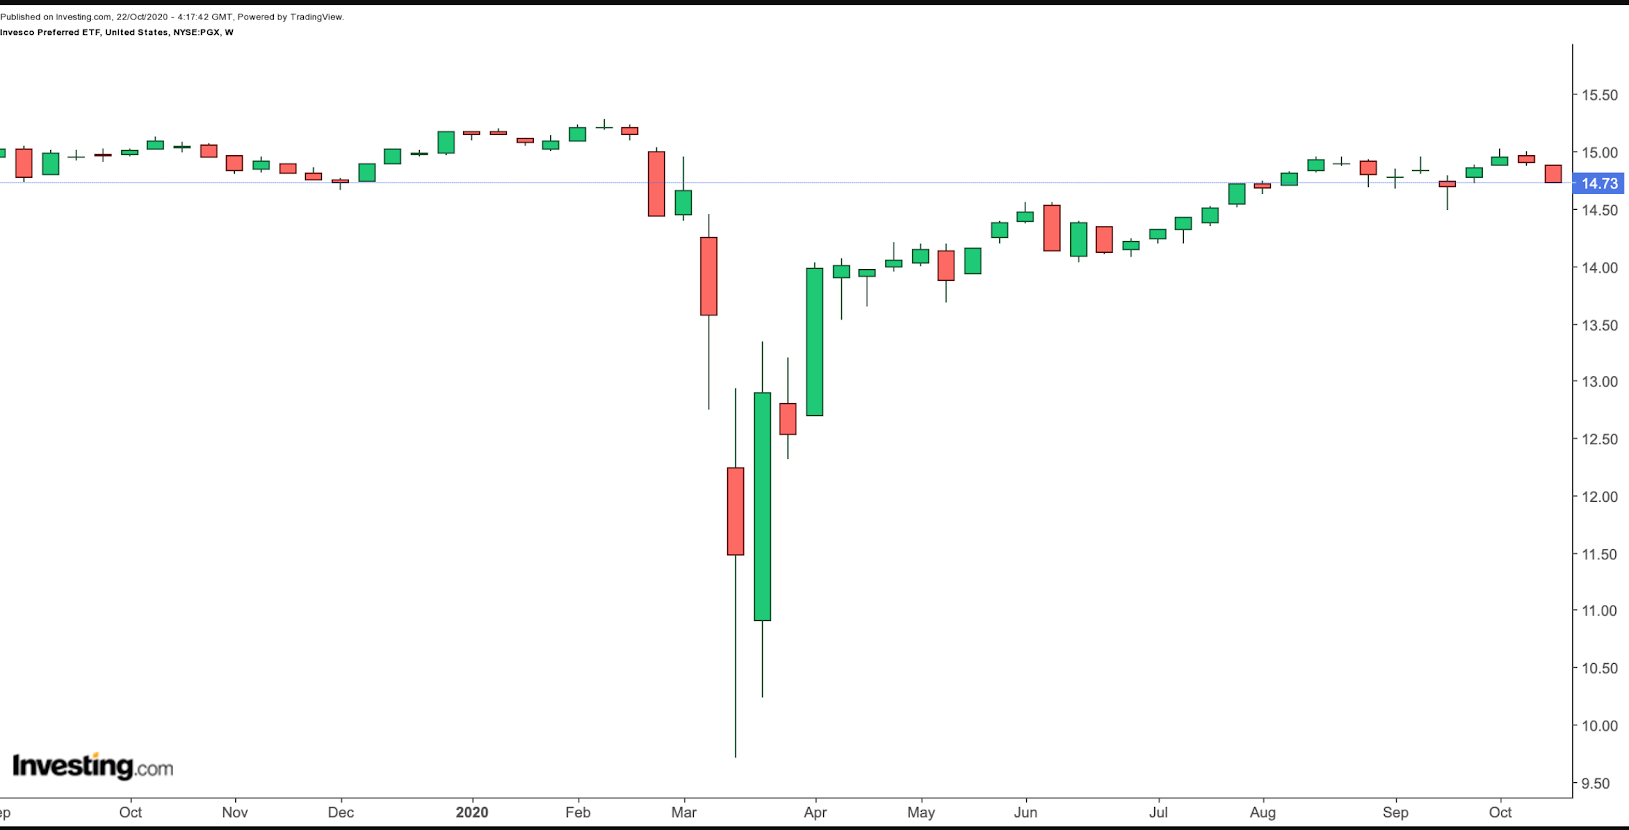
- Current Price: $14.73
- 52 Week Range: $9.71 - $15.28
- Dividend Yield: 5.04%
- Expense Ratio: 0.50%
The Invesco Preferred ETF (NYSE:PGX) provides exposure to fixed-rate US dollar-denominated preferred securities issued in the US. The fund started trading in 2008 and is rebalanced monthly.

PGX, which has 306 holdings, follows the ICE BofAML Core Plus Fixed Rate Preferred Securities Index. The fund is heavily weighted toward financials (63.35%), followed by utilities (13.72%), real estate (8.69%) and communication services (7.17%).
Preferred shares issued by Citigroup (NYSE:C), Wells Fargo (NYSE:WFC), JP Morgan Chase (NYSE:JPM), Bank of America (NYSE:BAC) and PNC Financial Services Group (NYSE:PNC) top the list of holdings.
So far in 2020, PGX is down about 1%. Below, we have listed the current dividend yield (DY) and year-to-date (YTD) price change of those five companies. The numbers may help investors better analyze the fund's returns versus owning the actual shares of companies in the fund.
- C — DY of 4.69%, YTD down 45.53%;
- WFC — DY of 1.75%, YTD down 57.6%;
- JPM — DY of 3.59%, YTD down 28.0%;
- BAC — DY of 2.98%, YTD down 31.46%;
- PNC — DY of 4.1%, YTD down 29.8%.
Different readers may come to different conclusions from looking at these numbers. Our first takeaway would be to define investment objectives and time horizons before allocating capital into an asset group. It is also important to appreciate the risk/return profile of different assets.
2. iShares International Preferred Stock ETF
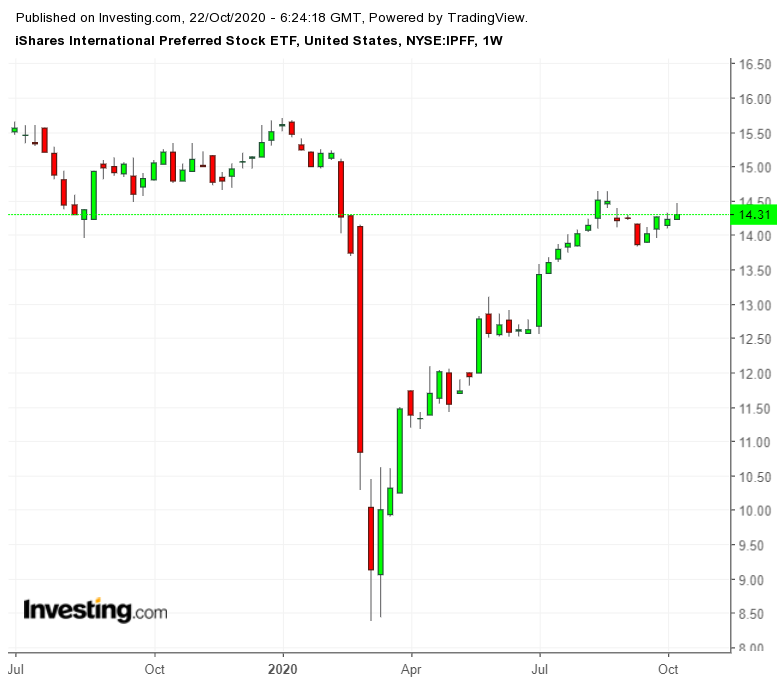
- Current price: $14.31
- 52-week range: $8.38 - $15.71
- Yield: 4.56%
- Expense ratio: 0.55%
The iShares International Preferred Stock ETF (NYSE:IPFF) provides exposure to preferred stocks outside the US, i.e., mostly in Canada (83.26% of assets), as well as the UK, Sweden and Singapore.

IPFF, which has 82 holdings, tracks the S&P International Preferred Stock Index. Among the top holdings are preferred shares issued by TC Energy (NYSE:TRP), Klovern AB (ST:KLOVa), Canadian Imperial Bank Of Commerce (NYSE:CM), Bank of Nova Scotia (NYSE:BNS), Royal Bank of Canada (NYSE:RY) and Bank of Montreal (NYSE:BMO).
In total, financial institutions make up 63.8% of net assets, which stand at $38.5 million. Next in line are industrials (25.71%) and utilities (5.34%). Since the start of the year, IPFF is down 7.44%.
Below, we have listed the current dividend yield (DY) and year-to-date (YTD) price changes of four of the top holdings listed in the US. As in the case of PGX, these metrics may give a better indication of the fund's returns versus owning the actual shares of companies in the fund.
- TRP — DY of 5.63%, YTD down 19.4%;
- CM — DY of 5.7%, YTD down 8.05%;
- BNS — DY of 6.41%, YTD down 25.07%;
- BMO — DY of 5.23%, YTD down 20.49%.
Given the fund's exposure to Canada-based firms, we'll also look at the YTD returns and dividend yields of three other ETFs that focus on Canada:
- iShares MSCI Canada ETF (NYSE:EWC) — DY of 2.99%, YTD down 6.01%;
- JPMorgan BetaBuilders Canada (NYSE:BBCA) — DY of 2.63%, YTD down 6.42%;
- SPDR® Solactive Canada ETF (NYSE:ZCAN) — DY of 2.99%, YTD down 6.01%.
We would encourage potential investors in any asset to conduct due diligence and analyze a given financial product from different angles before hitting the "buy" button. It is important to look deeper than headline news and search for alternative assets that may also provide a similar exposure within a possibly better risk/return profile.
