- U.S. futures lag behind global stocks on mixed tariff signals from China
- European banks outperform, defying deepening negative interest rates forecasts
- Treasury yields continue upward journey despite interest rate cuts expectations
- Oil rebounds after firing of hawkish White House advisor Bolton prompts price dip
Key Events
Futures on the S&P 500, Dow and NASDAQ 100 drifted this morning, bucking a stronger global climb even after reports China was exempting some U.S. goods from trade tariffs hikes, and ahead of an expected policy stimulus from the European Central Bank.

While news from China sparked hopes the country was looking to de-escalate trade tensions ahead of next month's meeting with the U.S., some key agricultural goods were still missing from the tariff exemption list—a factor that could have contributed to the lack of a more positive response by futures traders.
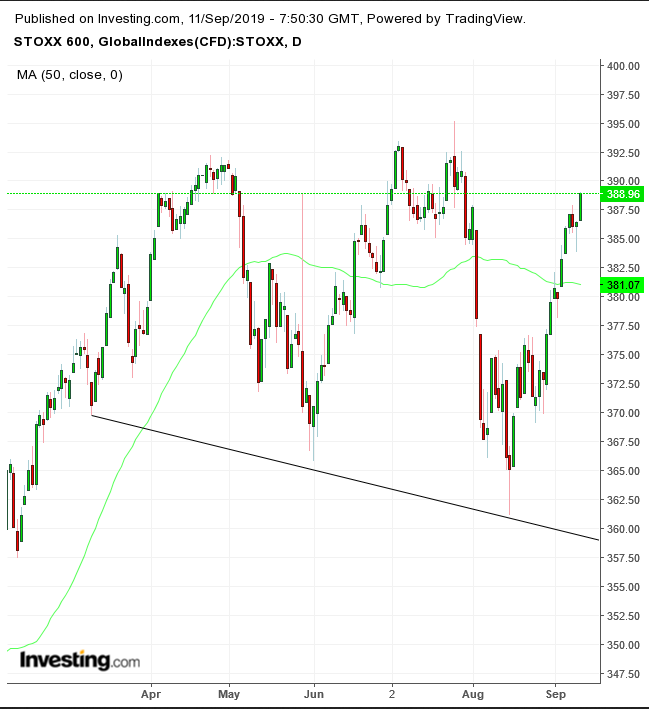
Europe's STOXX 600 posted a more upbeat climb, with miners and banks shares leading the gains. it’s nonetheless puzzling that investors are buying into banks when the consensus points to a ECB cut to the reference deposit rate to at least minus 0.5%. Some key European players such as Deutsche Bank and UBS have in fact warned the central bank policy is spoiling the backdrop for the financial sector by deepening negative rates.
Technically, the index rally resumes the surge since the Aug. 15 bottom, to gain a total of 6.5%—or 1.6% from the July 25 high it needs to best to resume the uptrend, which has been consolidating since late April.
In the earlier Asian session, regional equities ended mostly higher, taking cues from Wall Street’s rebound in the final five minutes of the session after reports emerged that China was willing to consider buying more American agricultural products, as part of its negotiating offers at next month's trade summit with U.S. officials.

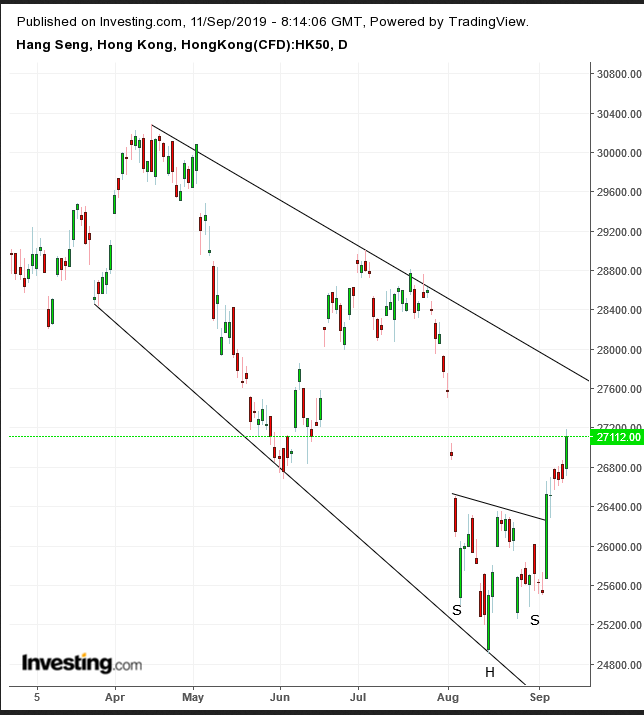
Hong Kong’s Hang Seng (+1.78%) was the clear outperformer, as banks and developers stocks boosted the beleaguered index to near a six-week high. Technically, the jump extended the small H&S bottom’s upside breakout toward the top to a falling channel since March.
China’s Shanghai Composite (-0.41%) was the only major Asian index to close in the red, as blue-chip stocks reflected local investors's uncertainty over Beijing’s latest pledge to increase the autonomy of the country’s financial market.
However, Chinese shares may get a helping hand from trillion-dollar fund manager T. Rowe Price, who said investors should buy Chinese stocks at floor prices rather than U.S. stocks nearing record levels. The fund manager believed the market already priced in any upcoming Fed easing.
Global Financial Affairs

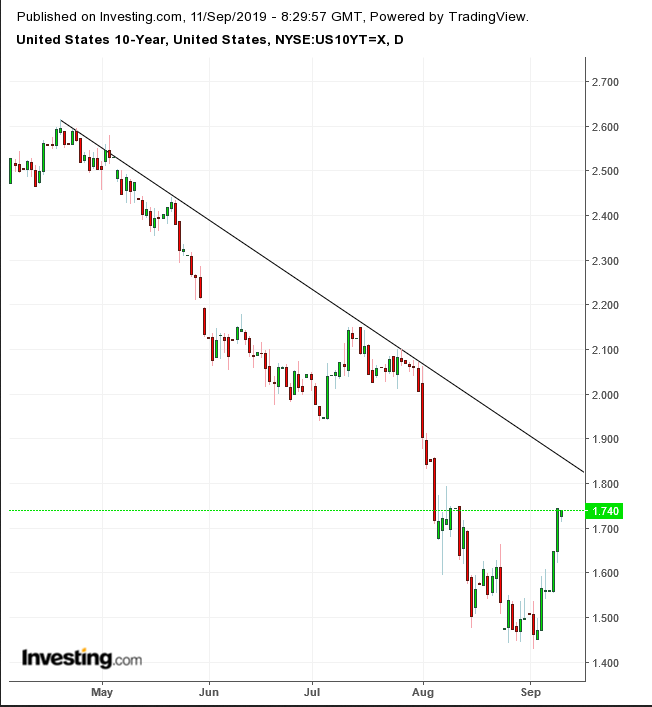
Meanwhile, yields on 10-year Treasurys continued to inch higher toward their downtrend line since mid-April after hitting a one-month high, ahead of Thursday's expected ECB rate cut, which could strengthen the case for other central bankers in the U.K. and in the U.S. to do the same next week.
Gold halted a four-day selloff even against a strengthening dollar and a risk-on market, which seems to corroborate the upward price impact of Russia and China increasing their reserves.

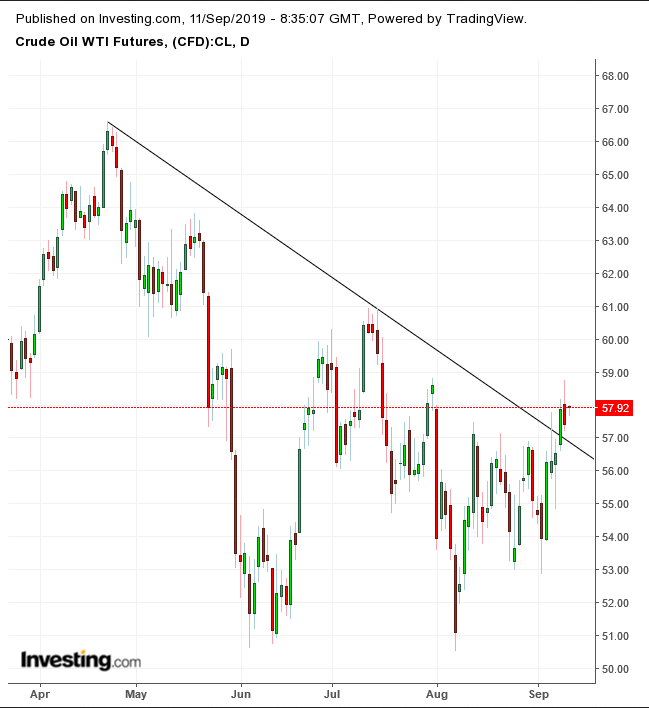
Oil prices rebounded after falling sharply on Tuesday on the news the Trump Administration had fired hawkish National Security Advisor John Bolton—which offset the effect of bigger-than-expected U.S. stockpile draws and weakening shale production. Analysts expect the latter element to be “very bullish” for oil prices. Technically, the WTI price remained above its uptrend line since Apr. 23, after breaching it on Monday.
Up Ahead
- OPEC’s monthly oil market report, which includes demand forecasts and production estimates, is due on Wednesday.
- ECB policymakers are widely expected to back an interest rates cut on Thursday and discuss all stimulus options, including QE. They will also publish forecasts for growth and inflation and President Mario Draghi will hold a press conference.
- U.S. producer prices data for August is due on Wednesday and CPI figures are scheduled for Thursday.
- Japan’s TOPIX gained 1.6%.
- The MSCI Asia Pacific index increased 0.8%.
- The Dollar Index climbed 0.17% to a weekly high.
- The British pound was little changed at $1.2349.
- The euro was unchanged at $1.1043.
- The Japanese yen weakened 0.1% to 107.70 per dollar.
- The yield on 10-year Treasurys slid two basis points to 1.71%.
- The yield on 2-year Treasurys dropped two basis points to 1.66%.
- Germany’s 10-year yield rose less than one basis point to -0.55%.
- Australia’s 10-year yield gained six basis points to 1.144%.
Market Moves
Stocks
Currencies
Bonds
Commodities
