Unlike investing in general commodities ETFs that cover assets like gold, silver and oil, niche exchange-traded products focus on specific parts of the market that may seem obscure to most retail investors.
Some niche exchange-traded products may concentrate on companies that work with natural resources and basic materials, while others use futures. Another set may hold copper, platinum, palladium, coffee, corn, sugar or small-cap agriculture firms.
Understanding a niche fund's specific investment style is crucial before committing new capital since volatility of returns is likely to be elevated as the focus is on smaller markets or narrower asset classes.
Those with a company-focus are more affected by the general direction of the stock market, while ETFs that hold derivative products are impacted more by price movement around contract-expiration dates and the gearing that derivatives may offer. In the case of agricultural products, the choppiness of returns can also depend on the weather, with risks such as droughts or harsh winters.
As the appeal of ETFs grows, several of these niche products now have well over $1 billion in assets. Still, many are relatively new and are continuing to expand their asset base.
With all that information, let's look at two funds:
1. VanEck Vectors Agribusiness ETF
- Current Price: $67.73
- 52-Week Range: $42.52 - $69.43
- Dividend Yield: 1.34%
- Dividend Distribution Frequency: Annually
- Expense Ratio: 0.56% per year, or $56 on a $10,000 investment
The VanEck Vectors Agribusiness ETF (NYSE:MOO) provides exposure to a broad range of companies involved in agri-chemicals, animal health, fertilizers, seeds, farm equipment, aquaculture, livestock, trading of agricultural products and plantations—such as grain, oil palms, sugar cane, tobacco leaves and grapevines.

MOO tracks the MVIS Global Agribusiness index and includes 52 stocks. The top ten holdings constitute over 55% of the fund's total net assets—slightly over 600 million. The largest five holdings are Zoetis (NYSE:ZTS), Idexx Laboratories (NASDAQ:IDXX), Deere (NYSE:DE), Bayer (OTC:BAYRY) and Nutrien (NYSE:NTR).
In terms of country weightings, the US tops the list with over 55%, followed by Germany, Norway, Japan, China and Canada. The most significant sectors (by weighting) are Consumer Staples (30.0%), Healthcare (26.4%), Materials (21.9%) and Industrials (17.7%).
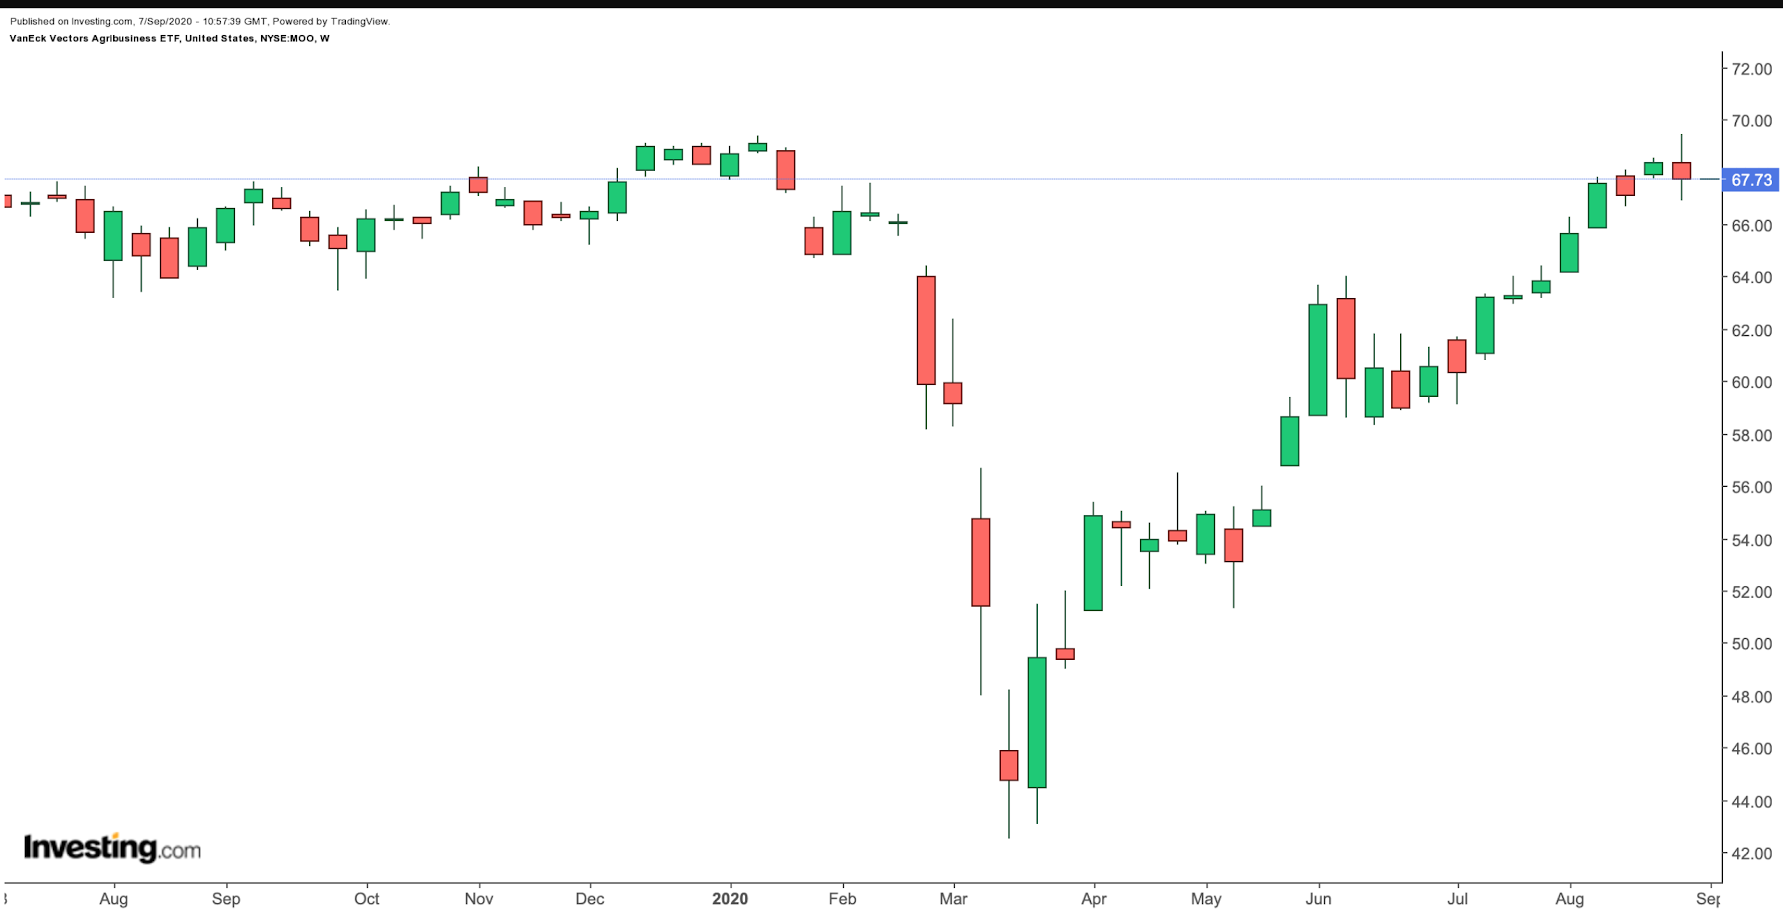
So far in the year, MOO is down about 1.5%, but since the lows in March, the fund jumped more than 60%. In fact, on Sept. 2, it made an all-time high of $69.43. Given the recent volatility and price-taking in broader markets, a further decline toward the $62.5 or even $60-level is possible, which would provide long-term investors a better margin of safety.
Many analysts concur that MOO's 2019 and 2020 showings have both been impressive in spite of headline risks. MOO managed to gain 20.75% in 2019, even as US-China trade tensions ran high and important farming regions endured poor weather conditions. 2020 has been marked by the coronavirus pandemic and has seen disruption to supply chains and production as a result of various lockdown measures taken worldwide. Nevertheless, since the March lows, the fund prospered as consumer staples and agricultural produce have demonstrated their value.
2. VanEck Vectors Rare Earth/Strategic Metals ETF
- Current Price: $40.99
- 52 Week Range: 23.91-44.41
- Dividend Yield: 1.59%
- Dividend Distribution Frequency: Annually
- Expense Ratio: 0.46% per year, or $46 on a $10,000 investment
The VanEck Vectors Rare Earth/Strategic Metals ETF (NYSE:REMX) provides exposure to companies involved in producing, refining and recycling rare earth and strategic metals and minerals.

REMX, which has 21 holdings, follows the MVIS Global Rare Earth/Strategic Metals index. In terms of country allocation, China tops the list with over 50%, followed by Australia (28.17%) and US (7.12%).
The fund's net assets are close to $200 million with the ten largest holdings constituting over 65% of that figure. Big names include Zhejiang Huayou Cobalt (SS:603799), China Molybdenum (SS:603993) and China Northern Rare Earth Group High-Tech (SS:600111).
"Rare earth elements are an essential part of many high-tech devices," according to American Geosciences Institute. The United States Geological Survey also backs the case that there is a rising demand for these metals with a release listing 35 mineral commodities and their critical functions for the US:
"Aluminum—used in almost all sectors of the economy; the platinum group metals—used for catalytic agents; rare-earth elements—used in batteries and electronics; tin—used as protective coatings and alloys for steel; and titanium—overwhelmingly used as a white pigment or as a metal alloy."
While different classifications may exist for rare and/or strategic metals, the fund's management highlights that close to 50 elements in the periodic table are considered rare earth/strategic metals.
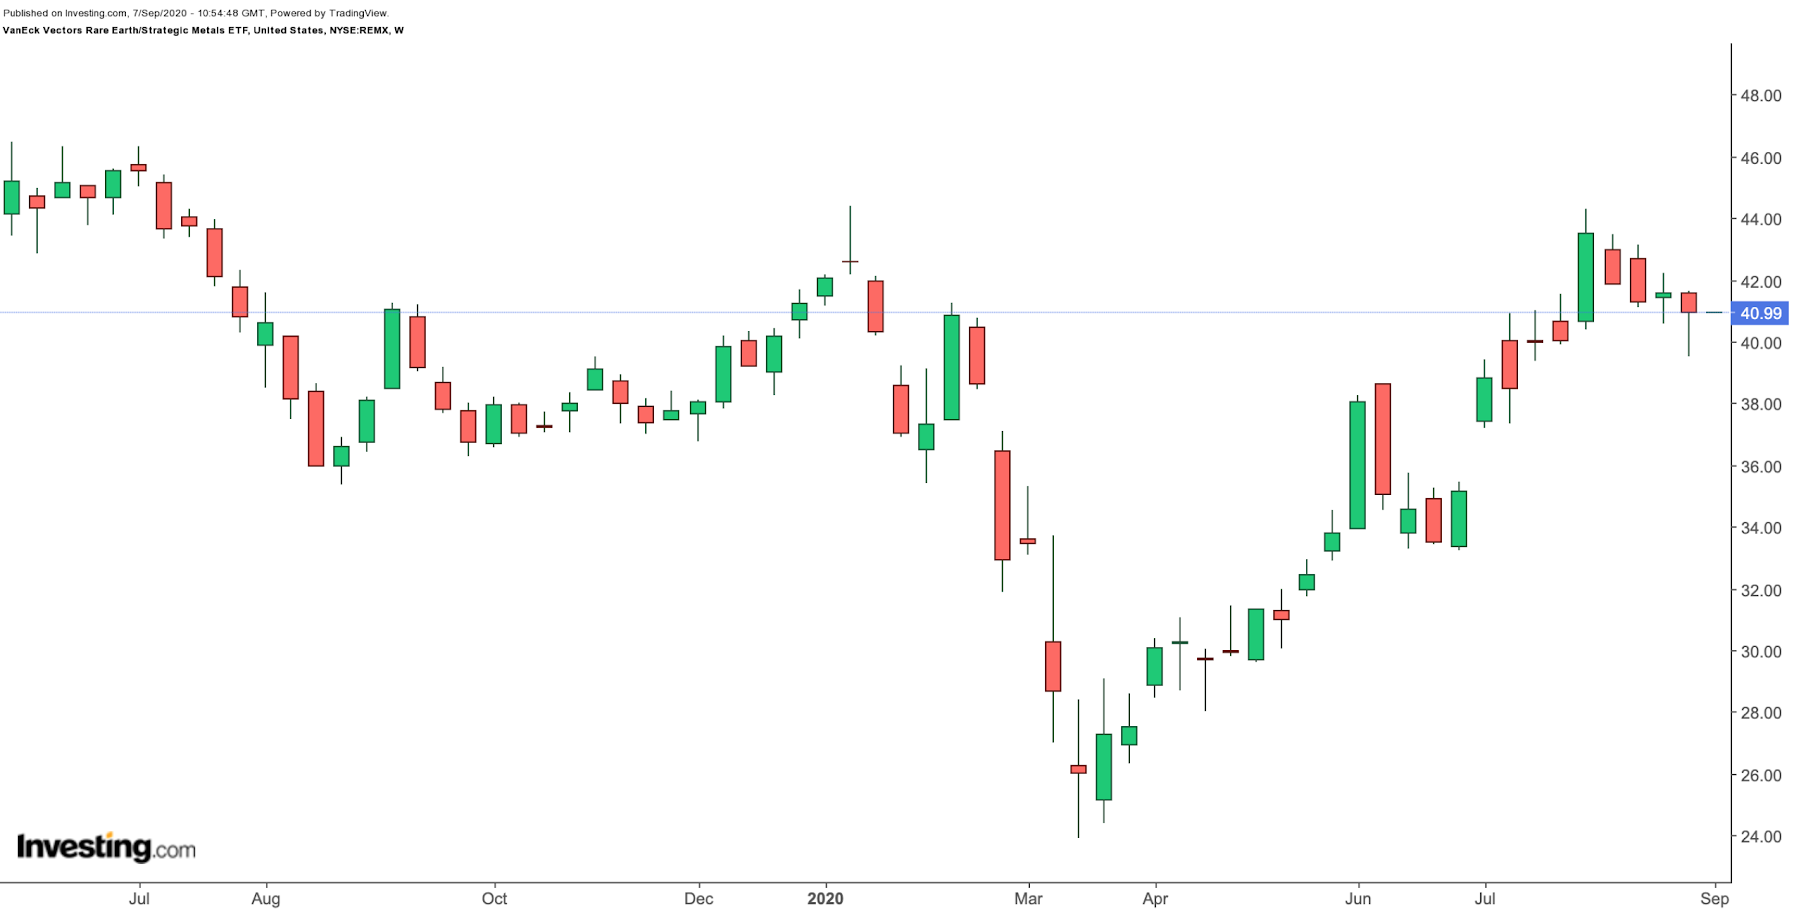
We are likely to witness a growth in the importance of this niche sector in the coming years. So far in 2020, the fund is up close to 2%. But since early spring, it has soared over 70%. Long-term investors may consider researching REMX, looking to $37.50 as an entry point.
