
- The absence of a Santa Claus rally has historically preceded disappointing years for the S&P 500.
- On the other hand, however, examining past annual returns reveals that strong gains are often followed by average positive years.
- While the Tech sector hits new highs, the market's trend remains bullish, but a reversal could be signaled by a collapse in Nasdaq and Russell 2000.
- Looking to beat the market in 2024? Let our AI-powered ProPicks do the leg work for you, and never miss another bull market again. Learn More »
Santa Claus didn't make it on time last year as the market didn't rally in the final week of the year. Historically, this precedes the beginning of a disappointing year for the S&P 500.
So, we might wonder: What happens after a year of positive performance?
What recently happened in 2022, following the positive performance of 2021 (+28%), was a negative year (-18%). In fact, as in life, we don't usually think that something negative will happen after a more than positive period.
But strong gains don't last long; every investor should consider the risk of downturns when markets are doing well and continue to rise too much.
Can S&P 500 Register Consecutive Positive Years?
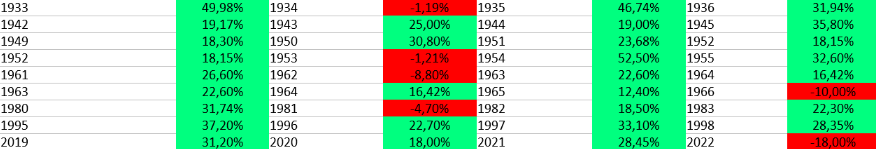
Looking at the past annual returns of the S&P 500, I have identified the times when the market recorded double-digit gains and the performance of the next three years.
As can be glimpsed from the chart, it often happens that excellent performance is followed by as many average positive years.
The periods identified, spanning 40 years of stock performance, represent 35% of the times when a double-digit positive year was followed by an average positive three-year period, except for a few.
But there is no need to go too far back; the stock market has had consecutive good years recently. The five-year period from 2019 to 2023 has seen returns of +31%, +18%, +28%, -18% and +26%.
So what we can infer from this data is that 60% of the time the good years are followed by an equally good year, 30% of the time it is followed by a double-digit positive three-year period, and 40% of the time the following year closed with an average loss of 4%.
This is decisive if we focus on the short term, where new trends can be born or existing ones strengthened, making equities both exhilarating and volatile at the same time. More often than not, long-term returns are the only ones that matter.
At the moment, the Tech sector (NYSE:XLK), which accounts for almost 1/3 of the entire S&P 500, has reached new highs.

A negative signal that could arouse bearish suspicions would be the breaking of previous highs (around the 175 area), the restriction of the 50 and 200 moving averages, and the breaking and then closing below the former (50).
But at the moment, from a medium-term perspective, we should spend more time looking for Buy stocks, not looking for Short going against the trend.
Is the Market Trend Still Bullish?
A market reversal would be signaled by the collapse of Nasdaq and Russell 2000, followed by the outperformance of consumer goods (NYSE:XLP) relative to the S&P 500. 
If consumer goods go on to recover the lows of 2021 and then beyond, this could indicate a possible rotation toward more defensive stocks and a less aggressive environment.
Also, a possibly stronger dollar would cause stocks to come under increasing selling pressure. 
A recovery of the dollar above 102, and a return above the 50 average, would likely confirm a more defensive investor bias. A rally to the 105 area could be the strongest signal that would give a bearish outlook to equities.
The trend at the moment remains bullish and our strategies are based on an objectively positive environment while a bearish view would probably fare better in the scenario assumed above.
It is important to make sure to identify all the answers in the coming weeks.
***
In 2024, let hard decisions become easy with our AI-powered stock-picking tool.
Have you ever found yourself faced with the question: which stock should I buy next?
Luckily, this feeling is long gone for ProPicks users. Using state-of-the-art AI technology, ProPicks provides six market-beating stock-picking strategies, including the flagship "Tech Titans," which outperformed the market by 670% over the last decade.

Disclaimer: This article is written for informational purposes only; it does not constitute a solicitation, offer, advice, counsel or recommendation to invest as such it is not intended to incentivize the purchase of assets in any way. I would like to remind you that any type of asset, is evaluated from multiple points of view and is highly risky and therefore, any investment decision and the associated risk remains with the investor.