China, whose economy trails only that of the US, is the world's most populous nation with approximately 1.44 billion residents. Therefore, investors pay attention to the Asian nation's economic numbers as well as quarterly metrics from many of the leading Chinese businesses.
For instance, in the first quarter of 2021, China's economy grew by a record 18.3%, compared with the same period of 2020. A large number of analysts are bullish on the country's economic prospects for the rest of the year. China, as well as a large number of emerging nations, tend to have higher growth rates than those achieved by many developed economies.
Over the past year, the Shenzhen Composite index and the Shanghai Composite index have returned close to 30% and 23%, respectively. However, both indices are now off the multi-year highs seen early February.
In recent weeks, many important Chinese firms, especially those with financial technology and e-commerce operations, have come under heightened regulatory scrutiny domestically. Markets recently got the result of the long-anticipated, anti-trust investigation against the e-commerce and technology giant Alibaba (NYSE:BABA).
Chinese authorities concluded that Alibaba violated the country’s anti-monopoly law and subsequently issued a record $2.8-billion fine (18.2 billion yuan). Analysts believe other names could also be fined in the coming months. However, at this point, it might be correct to assume this potentially adverse news has already been factored into their share prices.
Therefore, given the recent declines in prices of a number of Chinese heavyweights, today we introduces two exchange-traded funds (ETFs) for readers interested in participating in the potential growth of Chinese businesses.
1. KraneShares CSI China Internet ETF
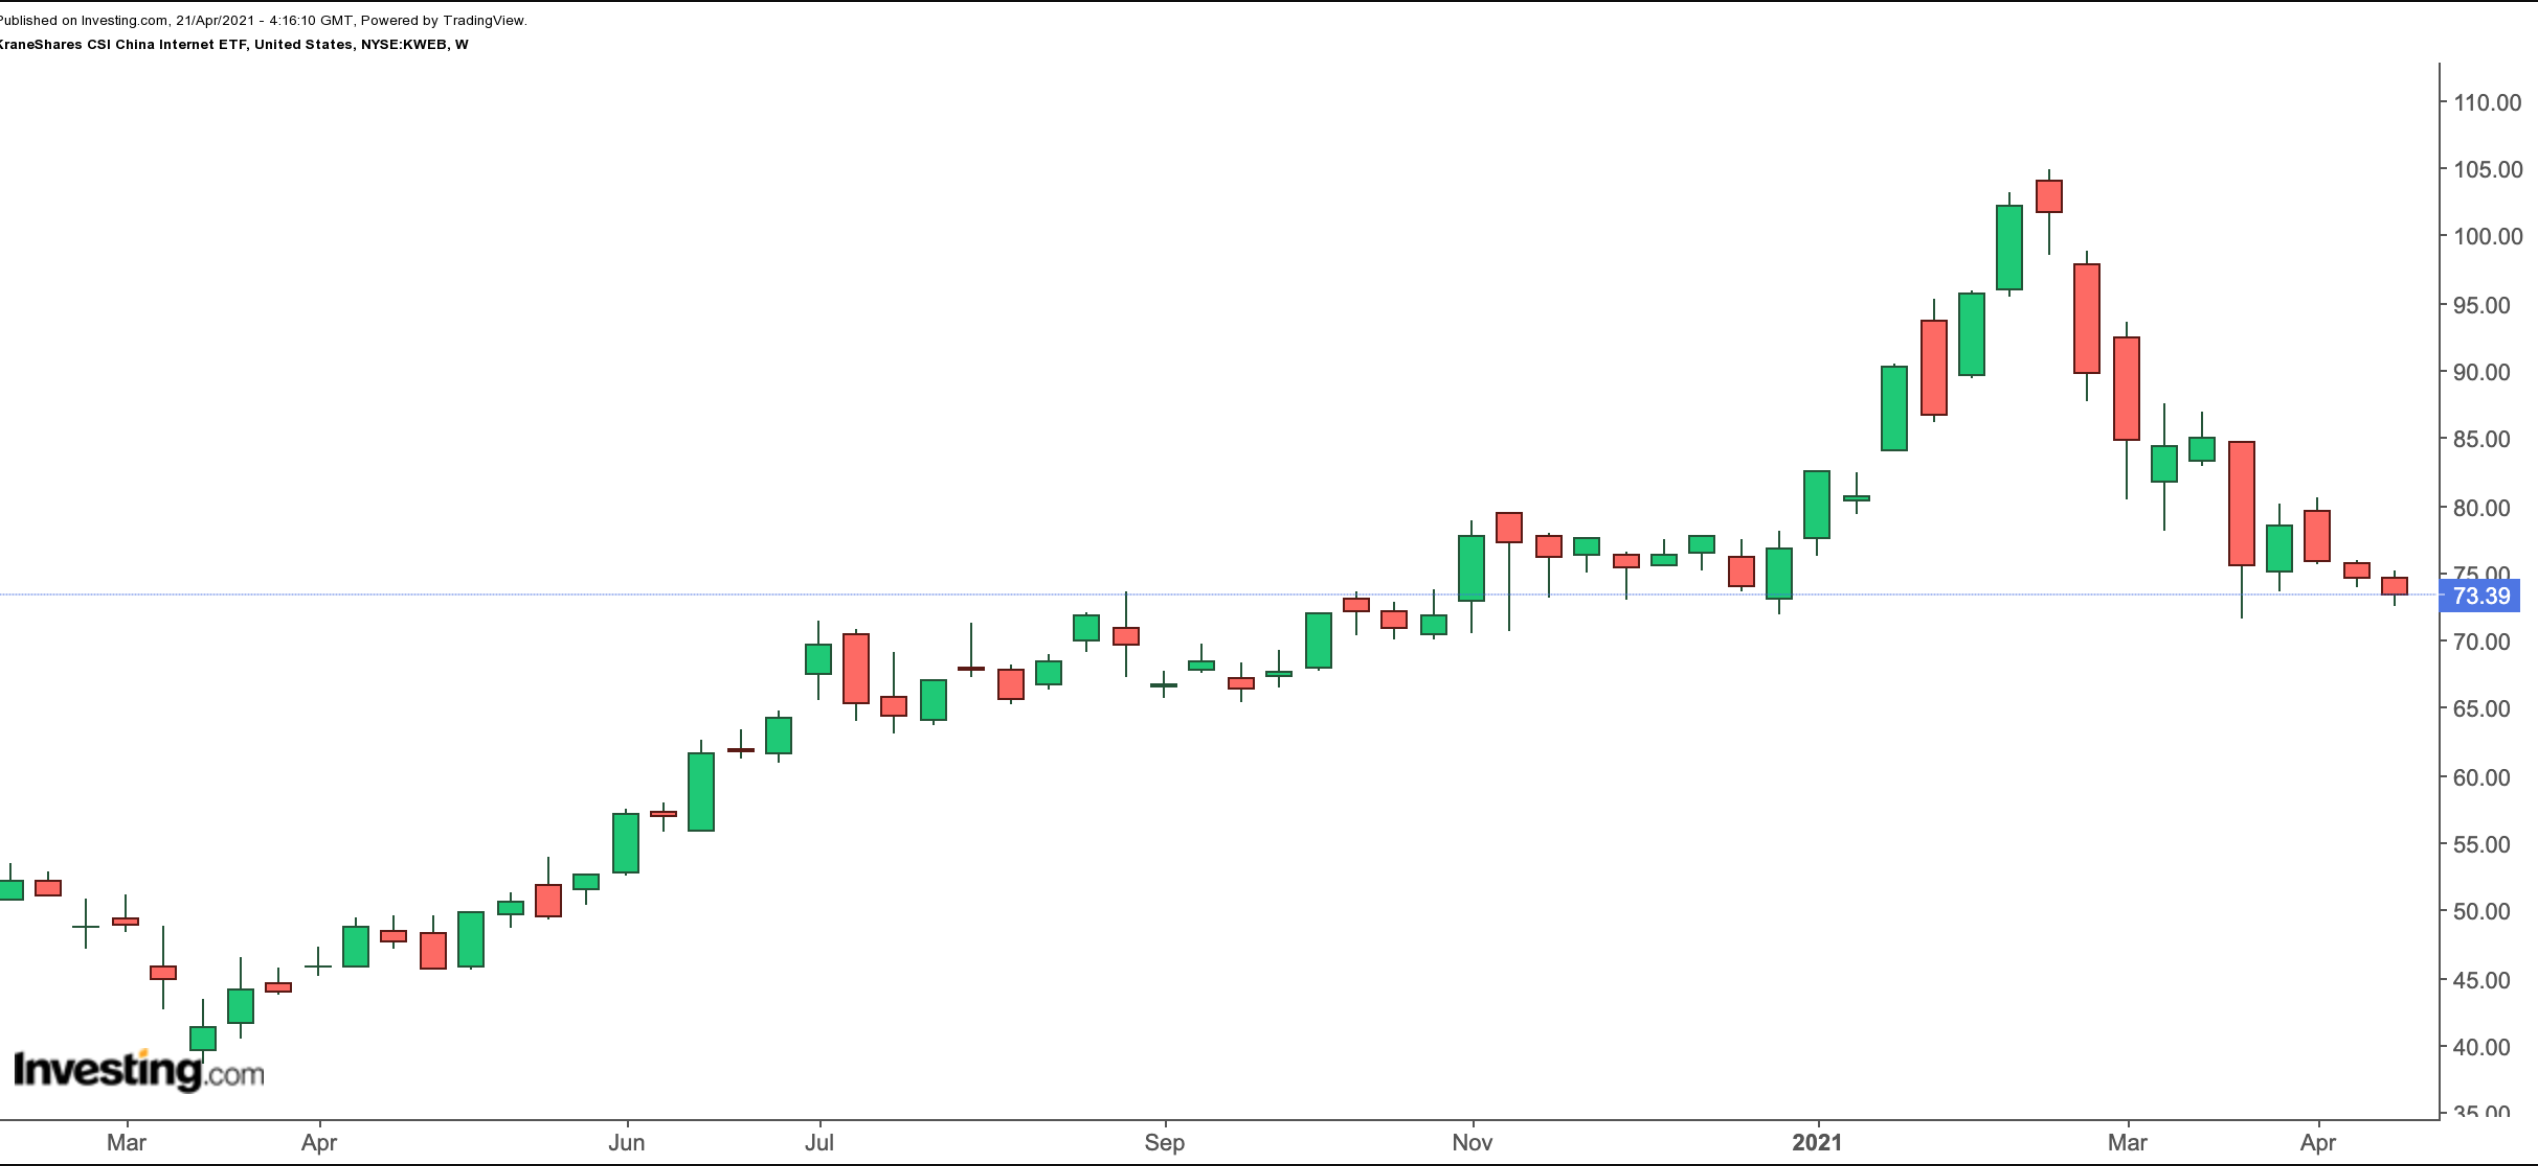
Current Price: $73.39
52-Week Range: $45.50 - $104.94
Dividend Yield: 0.30%
Expense Ratio: 0.73%
The KraneShares CSI China Internet ETF (NYSE:KWEB) provides exposure to a range of China-based firms whose primary businesses are either online or in internet-related sectors. Fund managers invest in companies with services similar to those offered by Amazon (NASDAQ:AMZN), Alphabet (NASDAQ:GOOG) (NASDAQ:GOOGL), Facebook (NASDAQ:FB), Twitter (NYSE:TWTR) or eBay (NASDAQ:EBAY).

KWEB, which tracks the CSI Overseas China Internet USD index, holds 44 companies. These firms are listed in the United States, while some have Hong Kong listings as well. Since its inception in July 2014, net assets have grown to $4.1 billion.
Social media and entertainment giant Tencent (HK:0700) (OTC:TCEHY)), Alibaba; food-delivery platform Meituan (OTC:MPNGF), the third-largest e-commerce group Pinduoduo (NASDAQ:PDD), internet-search and artificial intelligence group Baidu (NASDAQ:BIDU) and online entertainment provider Bilibili (NASDAQ:BILI) lead the stocks in the roster.
Year-to-date, KWEB is down 4.9%. But the fund was up 49% in the past 12 months and hit an all-time high in February.
Those readers wanting to invest in China-based e-commerce marketplaces as well as those businesses that are part of Internet search, social media, entertainment or microblogging industries, could consider buying KWEB around these levels.
2. Invesco Golden Dragon China ETF
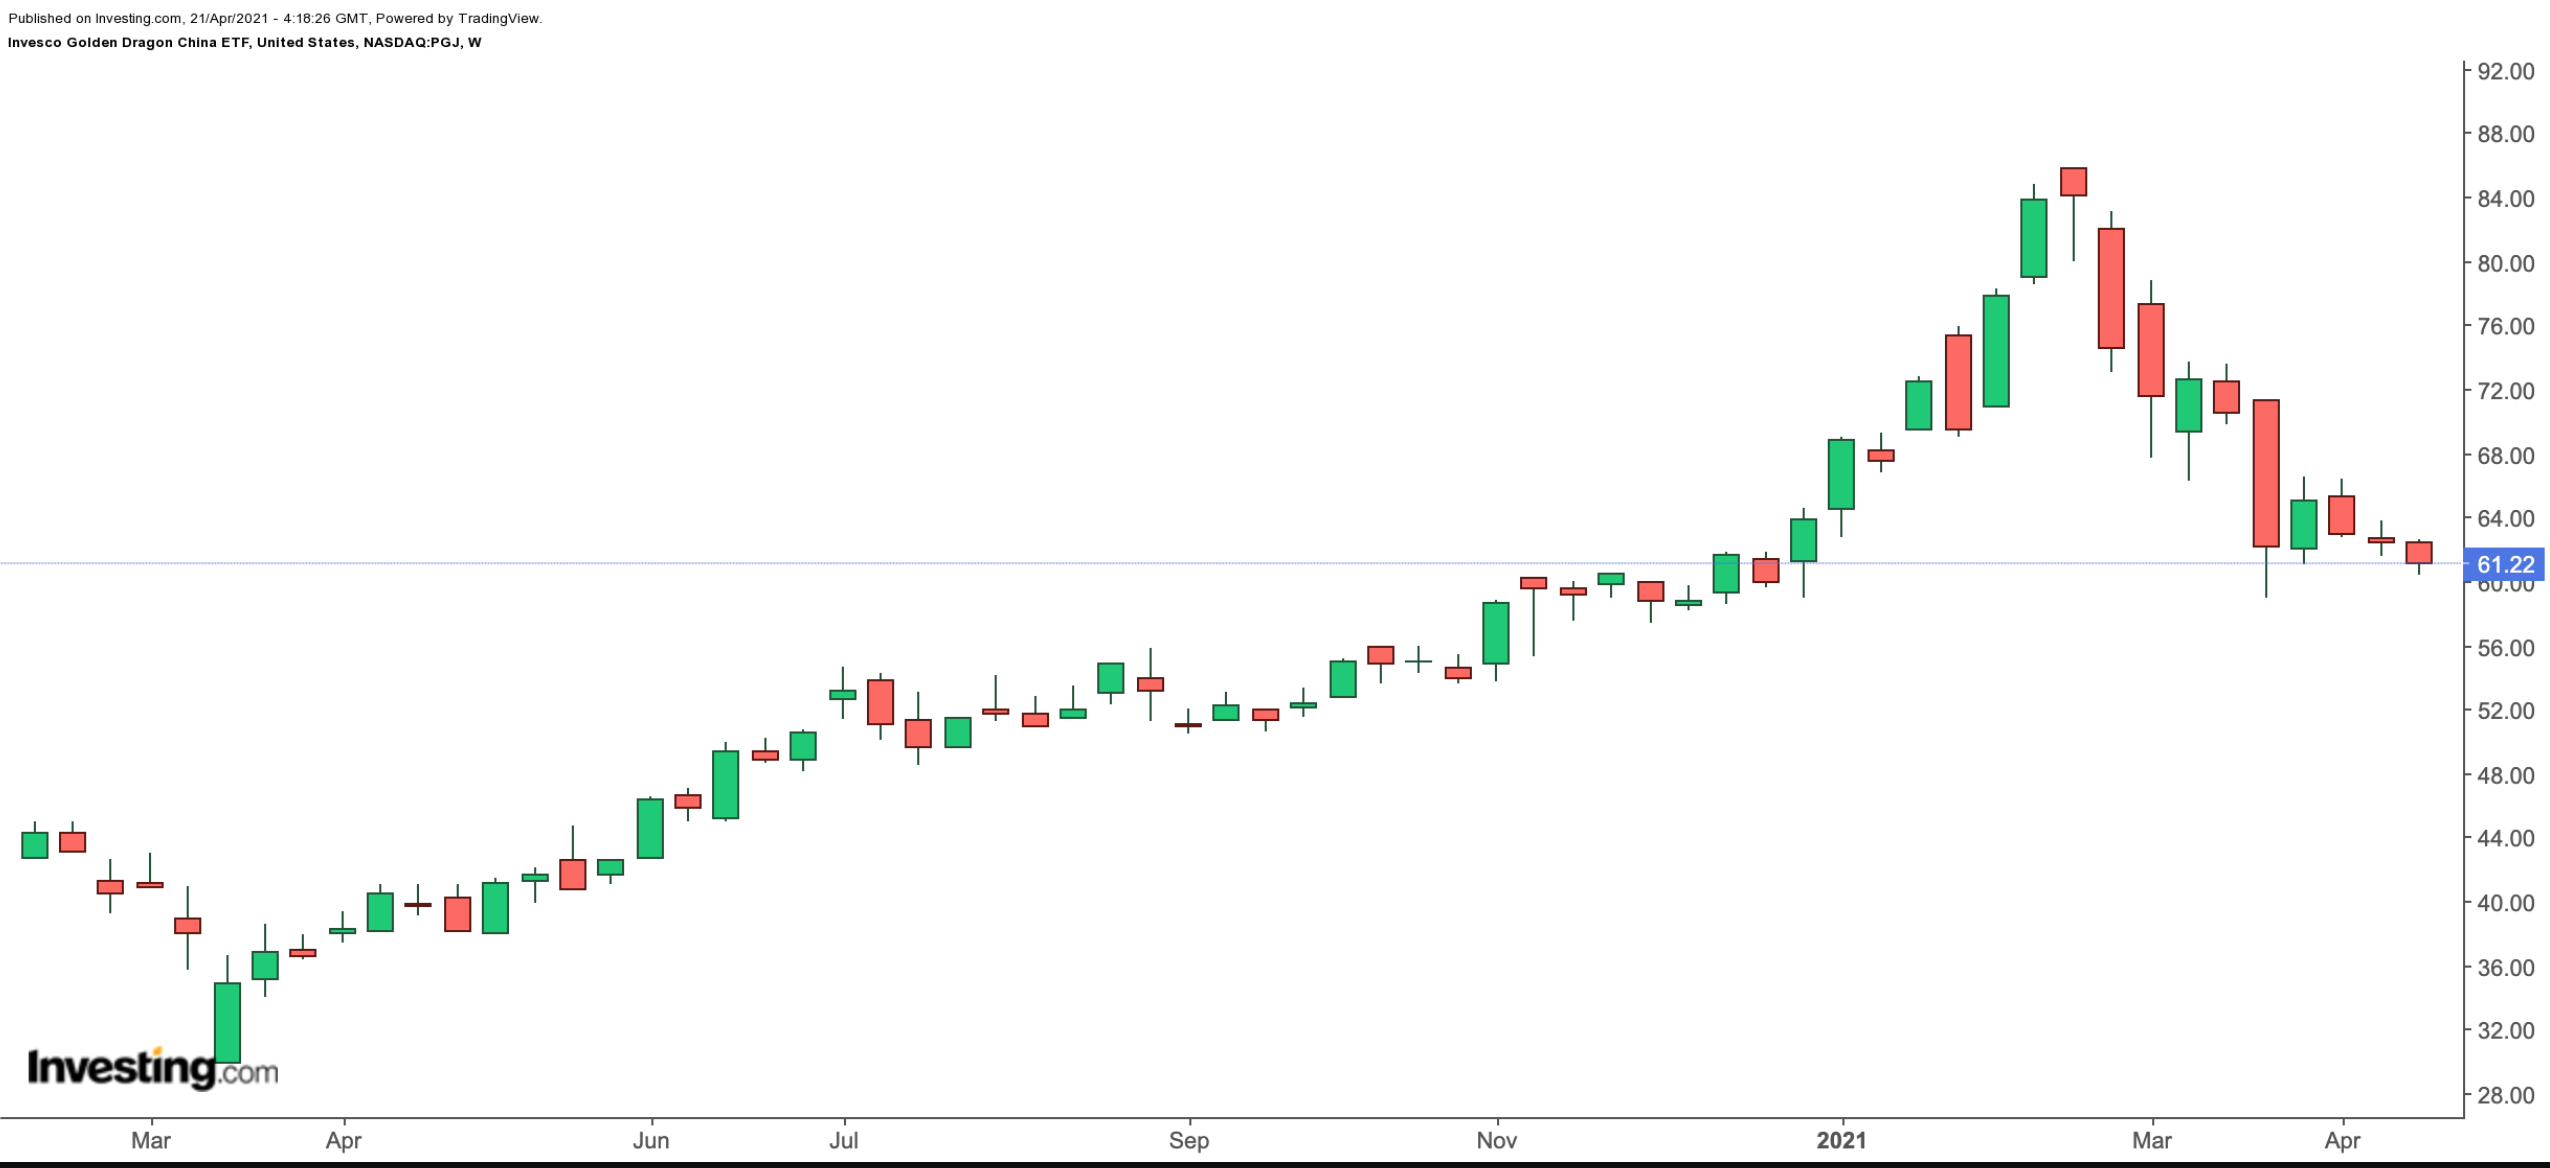
Current Price: $61.22
52-Week Range: $37.89 - $85.90
Dividend Yield: 0.18%
Expense Ratio: 0.70% per year
The Invesco Golden Dragon China ETF (NASDAQ:PGJ) invests in companies deriving a majority of their revenues from China. They are typically headquartered or incorporated in the country, but are listed on US stock exchanges. The fund started trading in December 2004 and net assets stand at $270 million.

PGJ, which has 86 holdings, is based on the NASDAQ Golden Dragon China index. Both the ETF and the index are rebalanced and reconstituted quarterly. In terms of sectors, consumer discretionary has the highest slice with 48.12%. Next in line are communication services at 26.66%, information technology at 9.92% and industrials account for 4.83%.
Among the leading names are Alibaba, gaming group NetEase (NASDAQ:NTES), other e-commerce titans JD.com (NASDAQ:JD) and Pinduoduo, Baidu and TAL Education Group (NYSE:TAL). The top companies make up about 60% of the ETF.
Like KWEB, so far in 2020, PGJ is down almost 5%. However, over the past year, the fund has returned nearly 50%, hitting a record-high in mid-February. Although a further decline below the $60 level could still happen, long-term investors who want exposure to the fastest growing economy worldwide might consider investing around these levels.
