Benzinga - by Piero Cingari, Benzinga Staff Writer.
The yields on U.S. Treasury bonds appear to be undergoing weeks of uncontrollable ascent, causing ripple effects in financial markets.
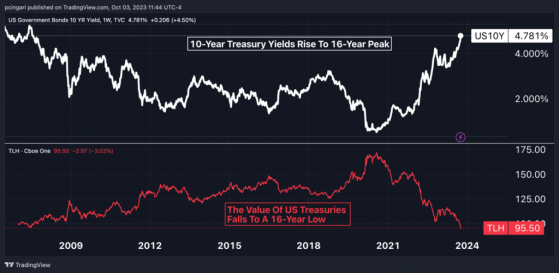
The 10-year Treasury yield, a crucial barometer for monitoring the cost of money in global markets, surged above 4.75% on Tuesday, Oct. 3, reaching its highest level since August 2007.
The increase in yields is inversely proportional to bond prices, resulting in the value of Treasuries plummeting to levels not seen in more than 15 years.
The US Treasury 10 Year Note ETF (NYSE:UTEN) registered five consecutive months of losses, declining by over 10% since reaching its peak in March 2023. The iShares 10-20 Year Treasury Bond ETF (NASDAQ:TLH) is trading at the lowest since July 2007.
Longer-dated Treasuries, as tracked by the iShares 20+ Year Treasury Bond ETF (NASDAQ:TLT), have lost more than half of their value since the onset of the pandemic in March 2020, hitting levels last seen in August 2007.
Chart: 10-Year Treasury Yields Vs. TLH ETF
Rising Treasury Yields Cause Ripples In Global Markets
The implications of rising Treasury yields are far-reaching, casting shadows on everything from stocks to gold. Investors are grappling with trepidation as they witness the fragility of assets exposed to risk and interest rates.The S&P 500 Index, as tracked by the SPDR S&P 500 ETF Trust (NYSE:SPY), a barometer of the stock market’s health, just limped through its roughest month of the year, setting a gloomy stage for October.
Gold, typically a safe haven in times of turmoil, was also feeling the heat. Its value is withering in the face of rising Treasury rates, a testament to the waning appeal of the yellow metal in times of heightened interest rates.
The Roots Behind Higher Treasury Yields
But why are U.S. Treasury yields rising this much?Several factors are contributing to the rise in Treasury yields, including an expansion of the U.S. government’s budget deficit, the ongoing Fed quantitative tightening program and the Federal Reserve’s restrictive stance on interest rates.
Rising Budget Deficit Exert Upward Pressure On Yields
According to the Bipartisan Policy Center’s deficit tracker, the U.S. government has run up a cumulative deficit of $1.5 trillion through August, a staggering $641 billion more than the same period last year. The Congressional Budget Office (CBO) foresees deficits ballooning to $2.0 trillion this fiscal year, doubling the previous year’s figure.This growing deficit means the U.S. government must issue more bonds to fund its spending spree. A surplus of bonds flooding the market naturally translates into higher yields, as investors demand more compensation for their capital.
Fitch Ratings made a bold move on Aug. 1 when it downgraded U.S. debt from the coveted AAA status to AA+, citing rising deficits, a budgeting process marred by flaws and the ever-looming specter of political brinksmanship.
Fed’s Tightening Efforts Add Fuel To The Fire
Another cog in this complex machinery is the Federal Reserve. The central bank is running its quantitative tightening program, effectively trimming its balance sheet by offloading assets, including Treasury securities. As of Sept. 26, 2023, the Fed’s balance sheet had shrunk to $8 trillion, marking a reduction of $700 billion since March and nearly $1 trillion since the peak in April 2022.Furthermore, the Fed is giving off signals it’s keen to keep interest rates elevated to coax inflation back to its 2% target.
At the September FOMC meeting, the Fed not only kept the door open for another rate hike this year but also scaled back its expectations for rate cuts in 2024, now hinting at only 50 basis points of reductions.
Chart: Fed’s Balance Sheet Is Shrinking
How High Can 10-Year Treasury Yields Surge?
Ten-year Treasury yields have been rising for five consecutive months now. If October witnesses another surge in yields, it will mark the longest monthly streak of increases since 1999.With yields currently hovering around 4.75% to 4.80%, the next immediate resistance level is the psychological 5% mark, which was previously reached in July 2007.
Above that level, there are the highs from June 2007 at 5.28%, and then the high from April 2002 at 5.42%.
It’s worth noting that from a historical perspective, 10-year yields above 5% are not uncommon. For much of the latter half of the past century, Treasury yields frequently danced above that threshold, reaching an all-time high of a jaw-dropping 15.82% in October 1981.
Monthly Chart Of US 10-Year Treasury Yields
Read Now: Higher Rates, Lower Leverage: Growth Stocks To Struggle While AI Offers Hope, Goldman Sachs Analysts Say
Photo: Shutterstock
© 2023 Benzinga.com. Benzinga does not provide investment advice. All rights reserved.
Read the original article on Benzinga
