- Nonfarm payrolls unexpectedly added 2.5 million jobs, with official unemployment rate falling
- NASDAQ hits new all-time high, as Tech sector continues leading stocks—a troubling sign
- Oil nears $40
- Gold falls
U.S. equities surged on Friday—locking in a trifecta of weekly gains—after the monthly jobs report massively beat expectations. The results seemed to support the V-shaped, immediate economic recovery narrative.
Yields reached an 11-week high and oil neared the $40 mark.
Miraculous Recovery Or Over-Stimulated Market?
May's nonfarm payrolls release surprised, showing 2.5 million jobs were added last month, while the unemployment rate fell to 13.3% from April’s all-time high. This buttresses the quick recovery argument by positing that even if it will take some time for growth to return to pre-COVID-19 levels, last week’s jobs data showed we're already on the right track.
Here's what gives us pause however: it took more than three decades for U.S. stocks to return to the heights of the roaring 20’s after the 1929 crash. In 2020 it’s taking us just months.
Of course, it's critical to understand that the 1929 crash and the recovery afterward occurred without a safety net. Now, markets are soaring because of unprecedented stimulus, which the Fed characterizes as unlimited.
Though we certainly don't know the answer, we can't help but wonder: is this a market recovering from its worst decline in a decade, even as the most suboptimal economic data in seven decades continues to be released, or is this a market pumped up with steroids, heading at some point for a meltdown?
As well, the Bureau of Labor Statistics, the agency that collects the data and issues the nonfarm payrolls release included a note at the bottom of the report saying a “misclassification error” had occurred. Based on this note, the “overall unemployment rate would have been about 3 percentage points higher than reported,” or 16.3% rather than the 13.3% announced.
That’s still less than the 19.7% forecast, but it illustrates how challenging it is to gauge even what is generally considered cold, hard data. Which thereby demonstrates just how much uncertainty we’re currently facing.
Data error notwithstanding, this rapid equity rebound all but erased the worst crash in years, with one benchmark, the NASDAQ Composite, even notching a fresh record high on the final trading day of the week.
Noted investor Warren Buffet (NYSE:BRKa) once famously said, “be fearful when others are greedy and greedy when others are fearful.“ The Oracle (NYSE:ORCL) of Omaha just took his own advice, decreasing his exposure to equities from 55% to 25%. His rationale: “stocks are expensive and the economy is terrible.”
The S&P 500 Index added 2.6% of value on Friday, bringing the total rebound to 42.75% from the March 23 low. The benchmark index is now just 6% away from its Feb. 19 record close.
In addition, on Friday, U.S. equities gave their best performance since May 18, when Cambridge, Massachusetts-based biotech Moderna (NASDAQ:MRNA) reported positive vaccine trial data. All four major U.S. indices climbed for the third straight week, their longest winning streak since December.
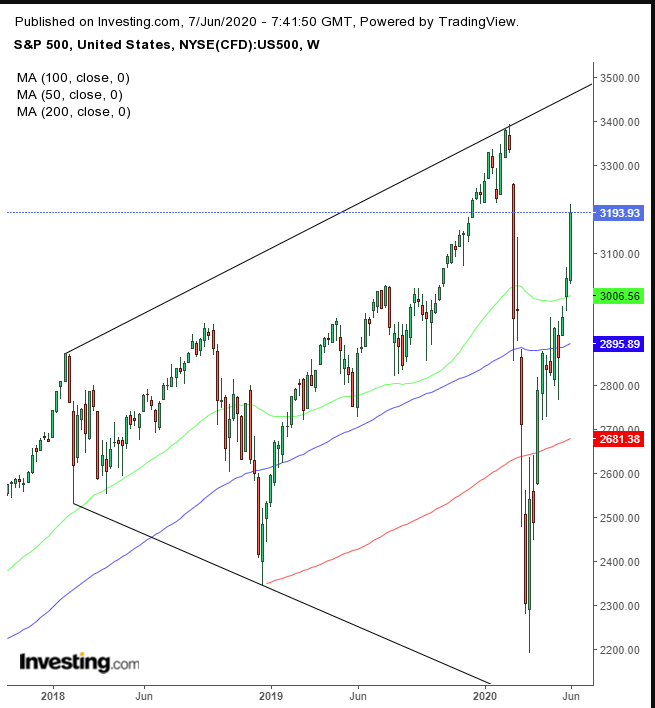
The SPX is trading within a broadening pattern, something that tends to develop at market tops when trade lacks leadership. Hence, stocks are drifting in the long-term, posting higher highs but also lower lows.
The Dow Jones jumped 3.1%, to gain 45.8% from its March 23 low. The 30-component mega-cap index is now 9% below from its Feb. 12 record close.
It was the tech-heavy NASDAQ, however (and ironically) which underperformed, rising “only” 2.1%. But it stood out as well, closing just 0.03% from its Feb. 18 record close even as it hit a new all-time high intraday. In addition, it matched the Dow’s 45.8% leap from the March 23 low.
This brings us to another point of concern. Market cycles generally include sector shifting. Previous crashes were usually followed by new market leaders. Technology, however, was the previous market leader. Which means the same group of stocks is leading this exuberant rally.
That's an anomaly. We would have more faith in the current rally if it switched to fresh horses.
The Russell 2000 outperformed both on Friday and during this rally overall, leaping 3.5% during the last day of the trading week, gaining a whopping 52.5% from its March 23 low. Of course, the small-cap index had the biggest distance to make up for; it's still 13.3% below its record close. The domestically focused index topped out more than a full month earlier than its peers, on Jan. 16.
Yields on the 10-year Treasury jumped 6 basis points, to 0.89%, extending a climb to its fifth day in a row, its longest steak since September, finishing at an 11-week high.
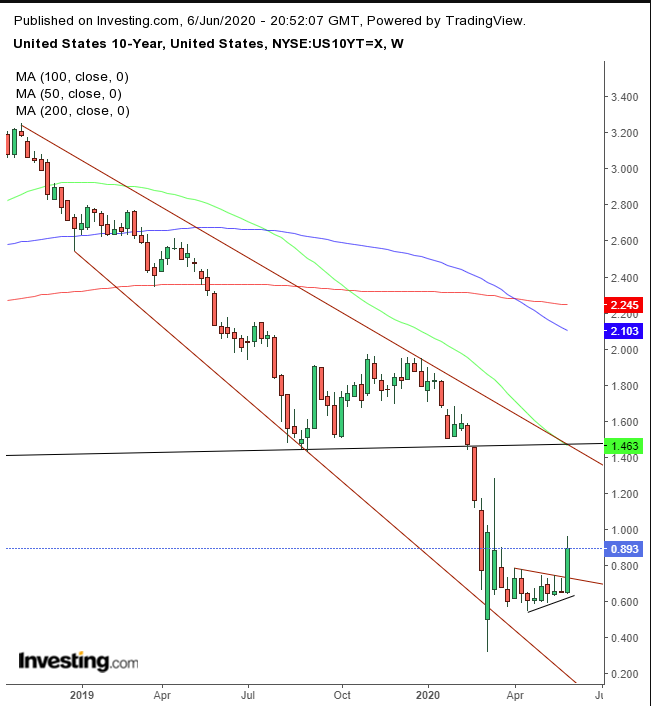
It’s difficult to say, however, how much of this Treasury selloff was fueled by faith in the economy or simply driven by traders buying short-dated U.S. bonds while shorting long-dated U.S. debt, betting the Fed will continue to keep interest rates depressed.
Yields provided an upside breakout to a symmetrical triangle after reaching the bottom of its falling channel since the 2018 high, suggesting a retest of the channel top.
The dollar rebounded, ending a six-day losing streak and trimming half of Thursday's losses.
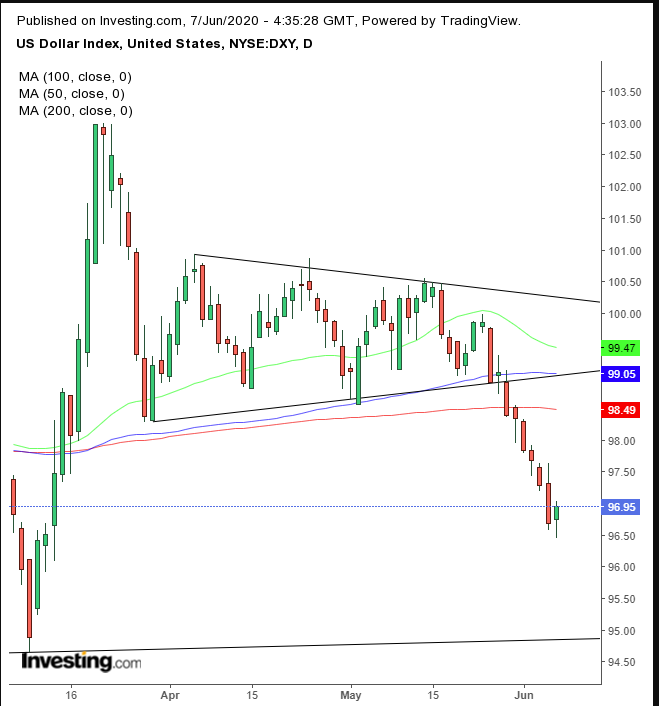
While oversold conditions are likely to trigger a corrective rally, the next support is at 95.
Gold suffered from a double whammy: a robust equity rally and dollar strength. The precious metal was pushed to its lowest point since April 3.
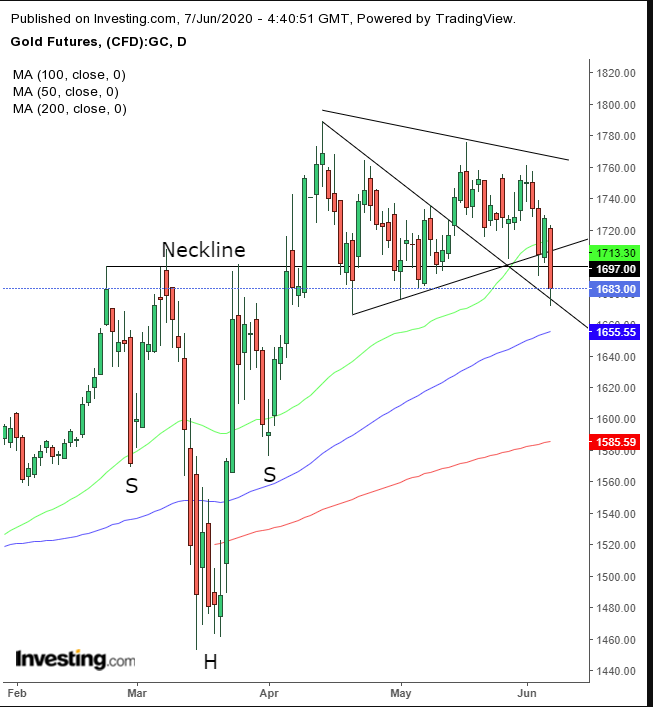
Technically, the price of the yellow metal blew out both a symmetrical triangle, from April 14-May 14, and possibly caused the failure of the larger symmetrical triangle that was still developing. However, gold’s H&S continuation pattern is still in play.
The oil market surprised yet again—much like the equity market. WTI crossed the halfway to $40 after OPEC and Russia reached a deal to extend production caps of almost 10 million barrels a day.
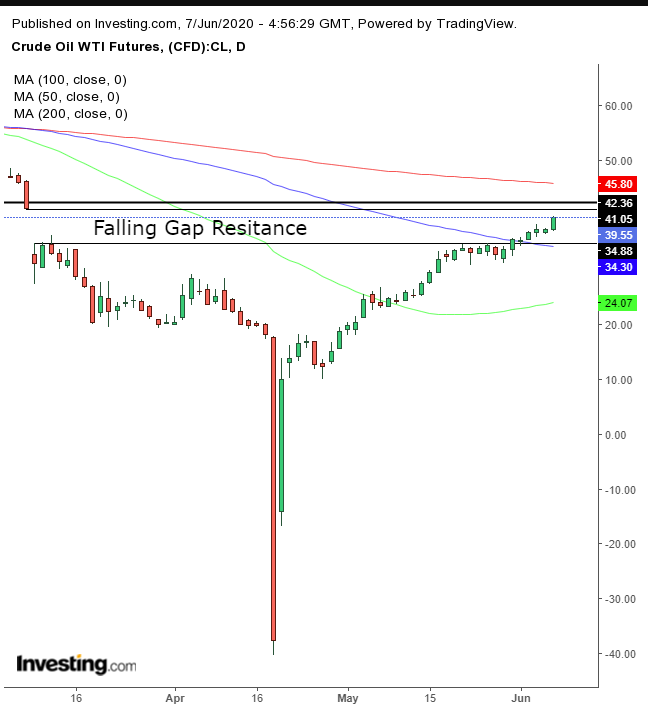
From a technical perspective, Friday’s move was powerful. The commodity surged 5.7% and closed near the top of the session, signaling bulls were in control.
However, the price is nearing an area likely to be rife with bearish resistance. That's the $40 psychological level, where bears might begin second-guessing themselves, compounded by the top of the presumed resistance of the March 9 falling gap, which itself was a confirmation of the flipped support of the Dec. 24, 2018 bottom (thick line). Above, looms the 200 DMA at $45.
Week Ahead
All times listed are EDT
Sunday
19:50: Japan – GDP: expected to rise to -0.5% from -0.9%.
Tuesday
10:00: U.S. – JOLTs Job Openings: anticipated to drop to 5.750M from 6.191M.
Wednesday
8:30: U.S. – Core CPI: seen to have climbed to -0.1% from -0.4%.
10:30: U.S. – Crude Oil Inventories: predicted to surge to 3.038M from -2.077.
14:00: U.S. – Fed Interest Rate Decision: forecast to remain steady at 0.25%.
Thursday
8:30: U.S. – Initial Jobless Claims: expected to come in at 1,500K, lower than last week's 1,877K claims filed.
8:30: U.S. – PPI: to rise to 0.1% from -1.3%.
Friday
2:00: UK – GDP: probably plunged to -18.7% from -5.8% MoM, and to -22.3% from -5.7% YoY
2:00: UK – Manufacturing Production: seen to plummet to -15.0% from -4.6%.
