US stocks rallied yesterday
On Wednesday, the stock market had a positive trading session.
The major indexes have closed as follows: the S&P 500 gained 1.49%, the Nasdaq went up 1.54% and Dow Jones closed at +1.60%.
The market rally has been driven by the revived consumer sentiment report for the month of December, which has shown the highest data since April.
The positive data of the consumer sentiment report has been led by the reduction of inflation.
So, we are closing the year with some good news: consumer sentiment is getting higher and inflation is slowing down.
Regarding the real estate sector, instead, the data issued yesterday on existing home sales have shown a persistent 10-month decline.
S&P 500 Technical Analysis - Daily Chart
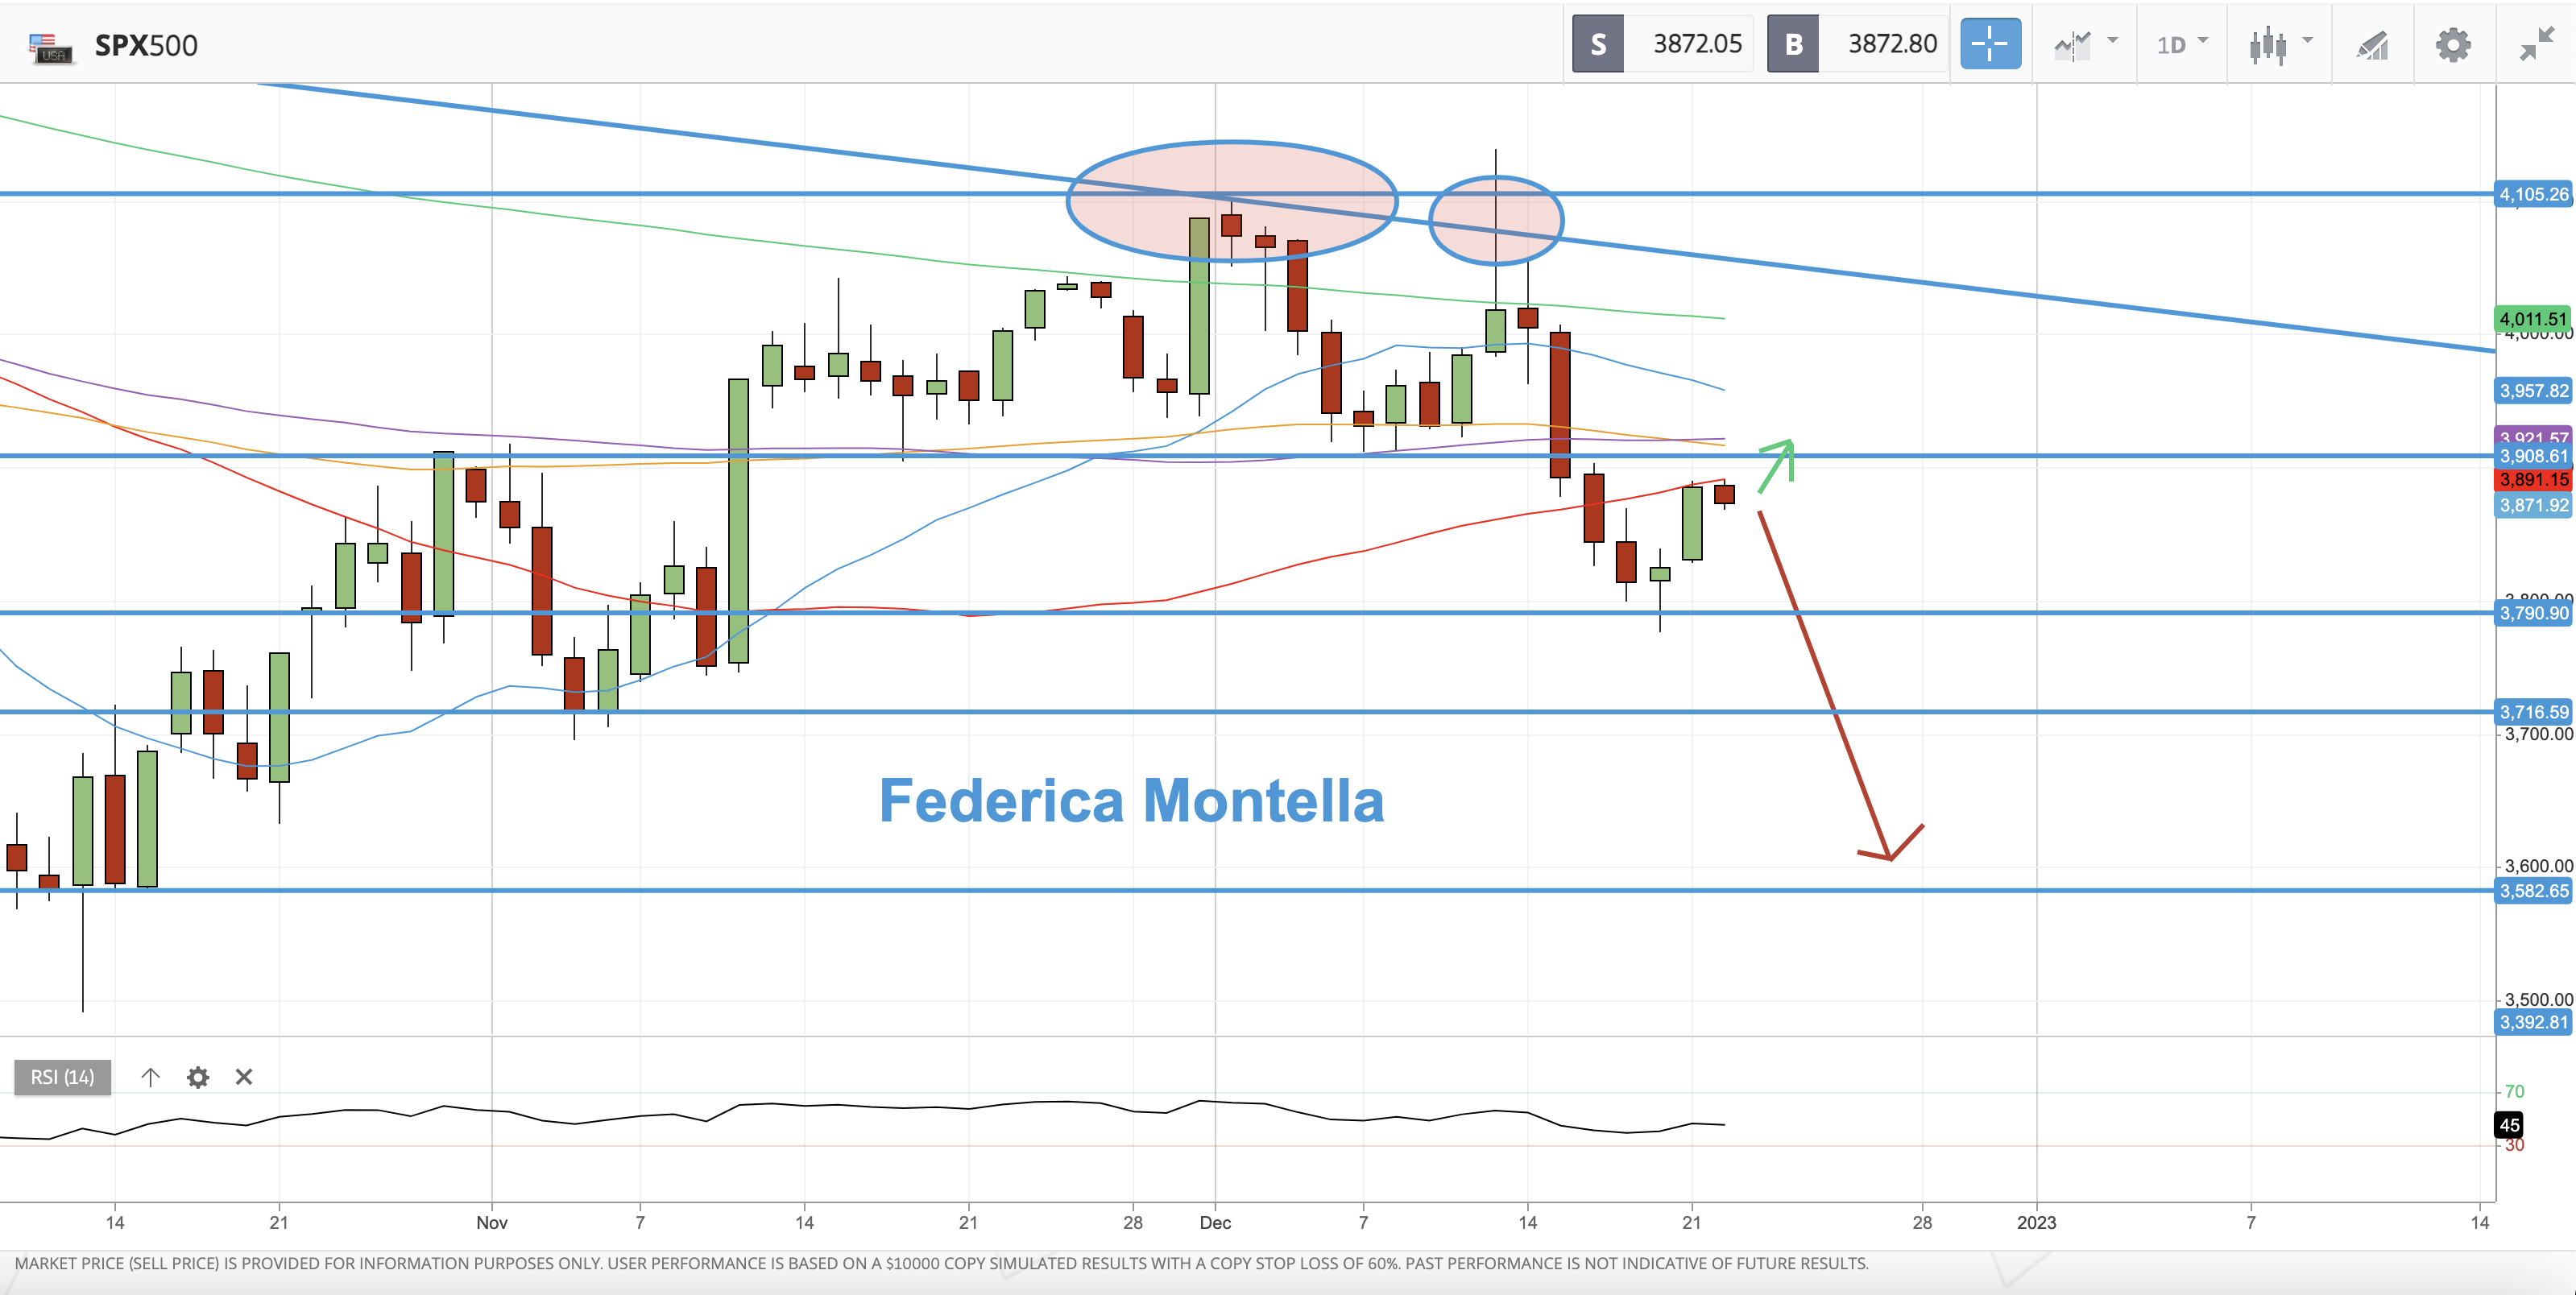
The S&P 500 index jumped yesterday, closing the day just below the 50-day MA (red moving average).
Today, the price is falling slightly, indicating a possible rejection at the 50-day MA.
If that is confirmed today, the price could retest the support at around 3800.
If that support will not hold, it's likely that the index will fall further and test the next support level at around 3700.
On the other side, the upside potential is very limited at the moment since there are many resistance levels for the price (all the major moving averages and the 3900 level).
The overall trend for the S&P 500 index is still bearish and this recent rally might be just a pause before the continuation to the downside.
The RSI rose slightly to 45, still indicating a bearish trend.
Overall, the index price could fall further in the upcoming days, until it reaches the oversold condition on the RSI.
Dow Jones Technical Analysis - Daily Chart
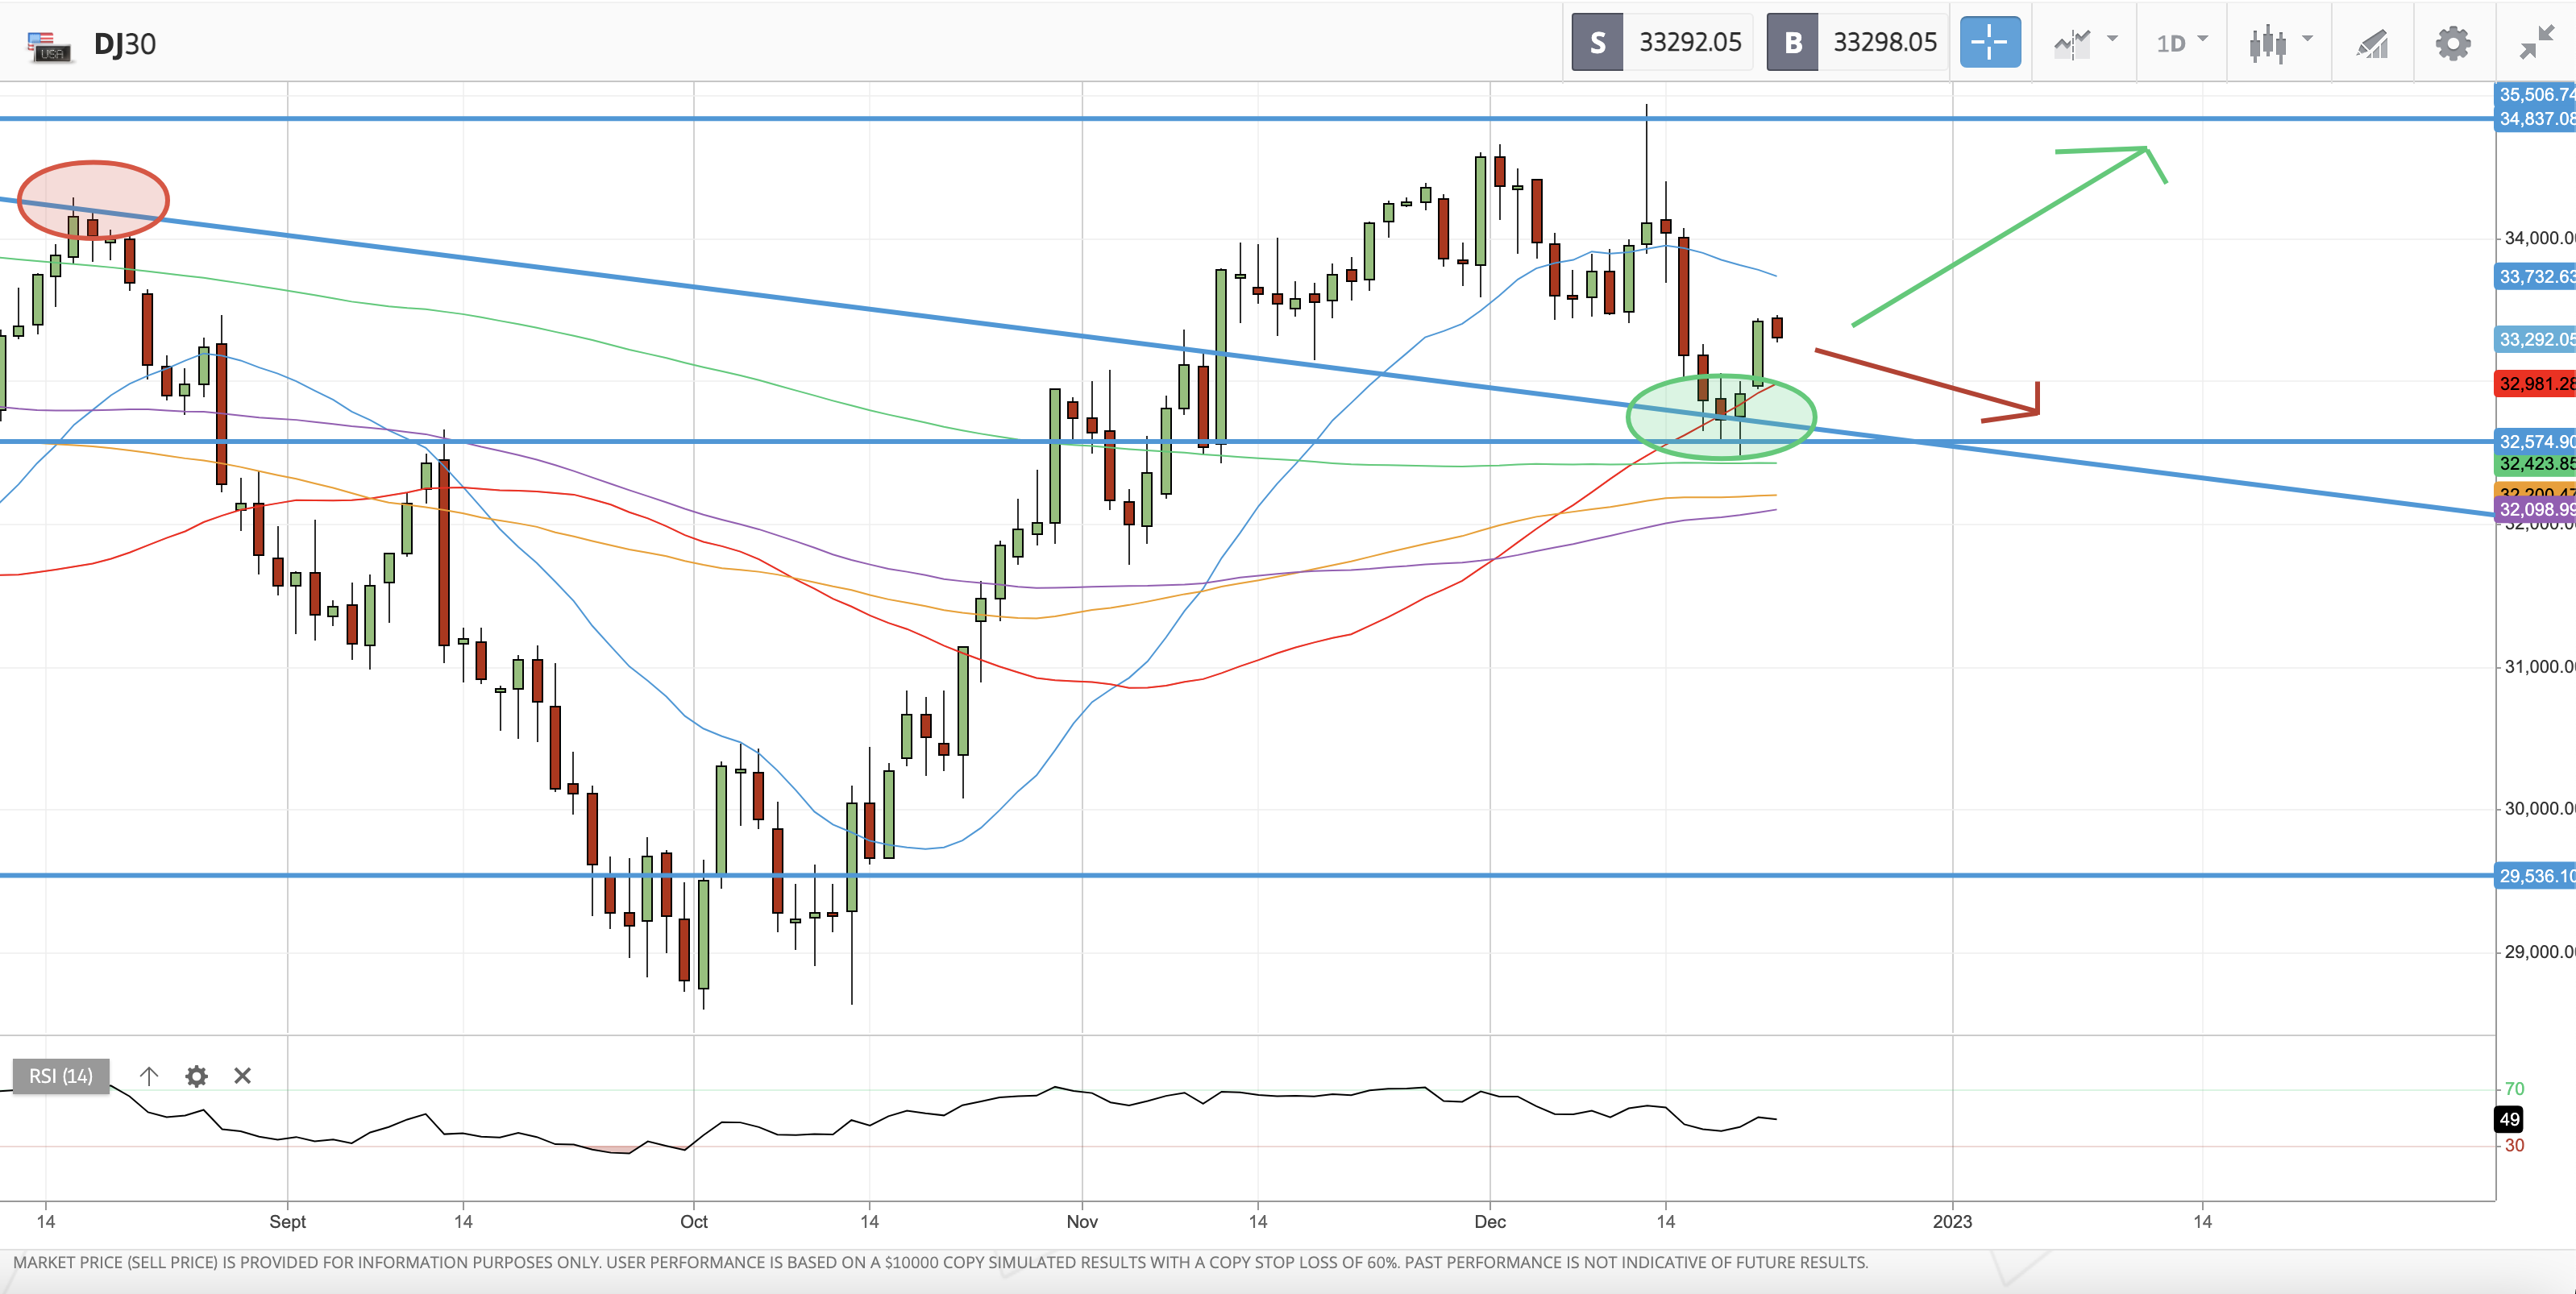
The Dow Jones Index is showing a bullish picture, as opposed to the bearish conditions of the S&P 500.
This index is in fact trading above all major moving averages, especially the 200-day MA (green moving average) and the 50-day MA (red moving average).
The price also bounced recently at the 32600 level, which acted as strong support.
It's likely that we could see a test of the 21-day MA (blue moving average).
A break above this level would open the possibility of further upside to the next resistance level of 34800.
A failed test of the 21-day MA would mean, instead, a likely retest of the support area between 32400 and 32900.
The RSI stands at 49, indicating a neutral trend.
The Dow Jones index has also completed a golden cross recently.
This happens when the 50-day MA moves above the 200-day MA.
This is a bullish sign for the short term.
If the Dow acts as a leading index for the overall US stock market, we could expect also the S&P 500 and the Nasdaq indices to mirror the price movements of the Dow Jones in the upcoming days.
Therefore, watch closely the price action of this index for clues on the next market direction.
Nasdaq Technical Analysis - Daily Chart
The Nasdaq Index chart looks very similar to the S&P 500 chart.
The index is also trading below all key moving averages and the price might find a lot of resistance to the upside, from the 11400 level and above.
The next support on the downside is likely the horizontal line at around 11700.
The overall trend for the Nasdaq index is also bearish.
The RSI stands at 42, confirming the bearish trend.
US Dollar Index Technical Analysis - Daily Chart
The US Dollar Index is also another chart to look at, in order to understand the next direction of the market.
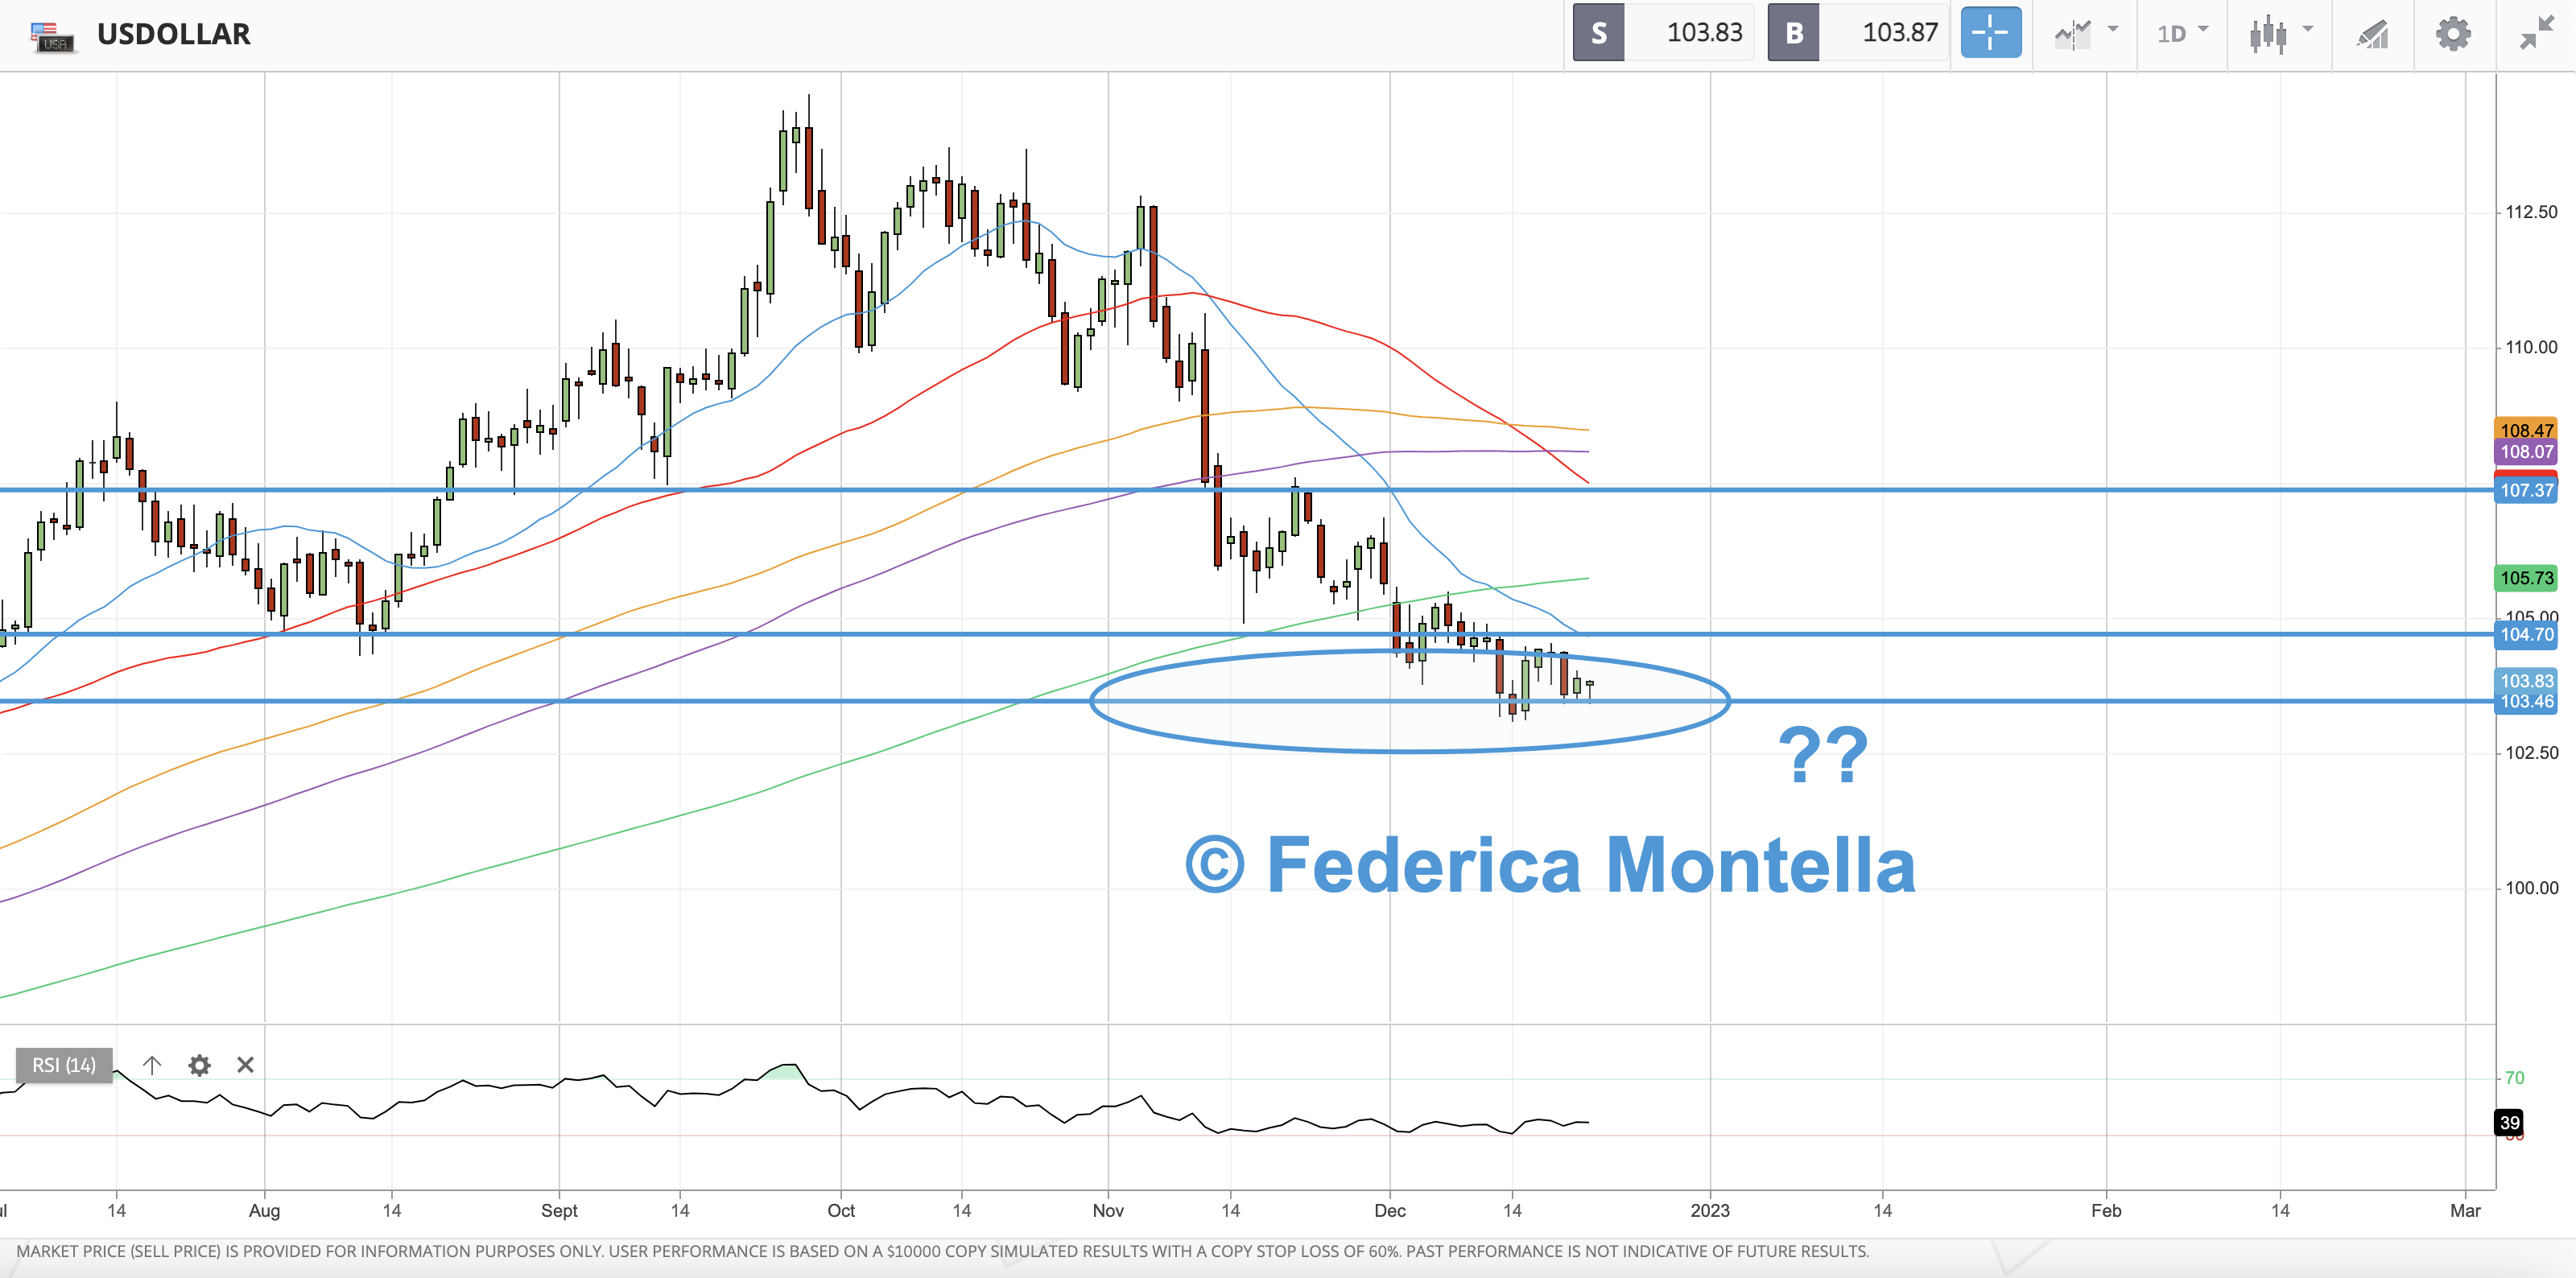
The Index started the downtrend after reaching the local top on 28 September 2022.
However, it seems that is finding support at the key level of 103.46.
A break below this level would mean a sell-off of the dollar, and a positive performance on the stock market.
On the other hand, if the index is able to hold the support, it will have to break above the resistance level of 104.70, which is both the horizontal line and the 21-day MA (blue moving average), and afterwards the 200-day MA (green moving average).
A break above those resistance levels would mean a rally in the dollar index and a further downside in the stock market.
Therefore, watch also this index for clues on the next market direction.
Sentiment Indicator - Fear & Greed Index
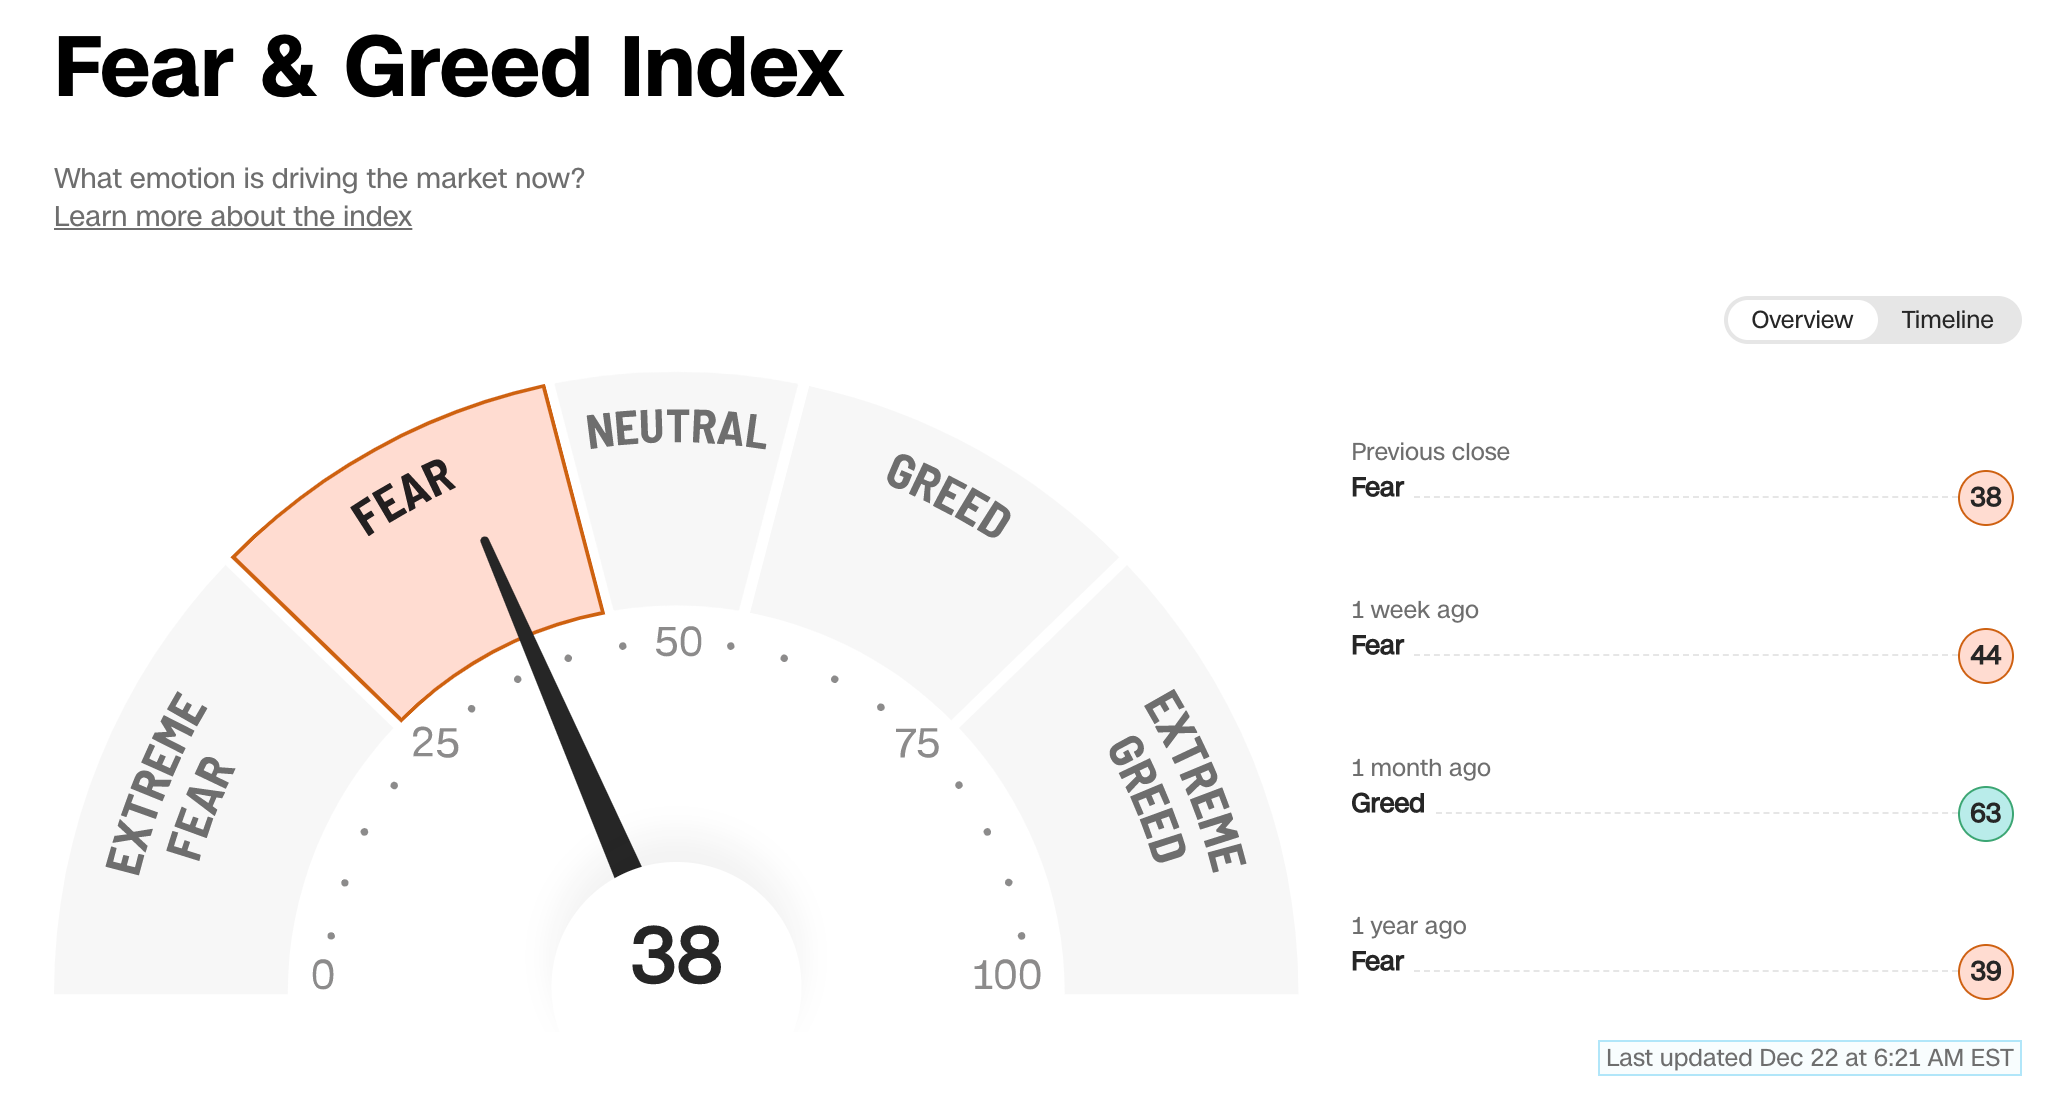
The market sentiment is at 38 in the "Fear" mode which is at the same level as the past two days.
Follow me
If you find my analyzes useful, and you want to receive updates when I publish them in real-time, click on the FOLLOW button on my profile!
Disclaimer
I’m not a financial advisor.
Any opinions that I publish may be wrong and may change at any time.
You should always carry out your own independent verification of facts and data before making any investment decisions.
Past performances are not indicative of future results.
I do not accept any liability for any loss or damage incurred from you acting or not acting as a result of reading any of my publications.
You acknowledge that you use the information I provide at your own risk.
Please be aware that all trading involves risk.
This content is for educational purposes only and is not investment advice.
- English (USA)
- English (India)
- English (Canada)
- English (Australia)
- English (South Africa)
- English (Philippines)
- English (Nigeria)
- Deutsch
- Español (España)
- Español (México)
- Français
- Italiano
- Nederlands
- Português (Portugal)
- Polski
- Português (Brasil)
- Русский
- Türkçe
- العربية
- Ελληνικά
- Svenska
- Suomi
- עברית
- 日本語
- 한국어
- 简体中文
- 繁體中文
- Bahasa Indonesia
- Bahasa Melayu
- ไทย
- Tiếng Việt
- हिंदी
Wall Street rallied, but how far can it go?
Published 22/12/2022, 13:21
Wall Street rallied, but how far can it go?
Latest comments
Loading next article…
Install Our App
Risk Disclosure: Trading in financial instruments and/or cryptocurrencies involves high risks including the risk of losing some, or all, of your investment amount, and may not be suitable for all investors. Prices of cryptocurrencies are extremely volatile and may be affected by external factors such as financial, regulatory or political events. Trading on margin increases the financial risks.
Before deciding to trade in financial instrument or cryptocurrencies you should be fully informed of the risks and costs associated with trading the financial markets, carefully consider your investment objectives, level of experience, and risk appetite, and seek professional advice where needed.
Fusion Media would like to remind you that the data contained in this website is not necessarily real-time nor accurate. The data and prices on the website are not necessarily provided by any market or exchange, but may be provided by market makers, and so prices may not be accurate and may differ from the actual price at any given market, meaning prices are indicative and not appropriate for trading purposes. Fusion Media and any provider of the data contained in this website will not accept liability for any loss or damage as a result of your trading, or your reliance on the information contained within this website.
It is prohibited to use, store, reproduce, display, modify, transmit or distribute the data contained in this website without the explicit prior written permission of Fusion Media and/or the data provider. All intellectual property rights are reserved by the providers and/or the exchange providing the data contained in this website.
Fusion Media may be compensated by the advertisers that appear on the website, based on your interaction with the advertisements or advertisers.
© 2007-2024 - Fusion Media Limited. All Rights Reserved.