
Market Overview
Market Overview
In an attempt to try and mitigate the economic impact of Coronavirus, global central banks seem to be acting in coordination. Rate cuts from major central banks such as the Federal Reserve, Reserve Bank of Australia and now Bank of Canada have been seen in recent days. Attention will be on whether the ECB and the Bank of England also follow suit. The question is whether a monetary policy response to a supply-side shock is the right move. It needs to come in conjunction with a fiscal response from governments, and it is beginning to now come. The supra-national body, the IMF has pledged $50bn of support to low-income countries, whilst in China there will be a package of 100bn yuan (c. $16bn) for its own coronavirus prevention. As for markets, there has been an element of stabilization on bond yields in the past 24 hours, with the US 10 year yield back above 1.00% again, helping the dollar to steady. Forex majors seen to be relatively settled this morning, at least relative to the huge volatility of recent sessions. Focus for oil traders today will be on how talks between OPEC members decide to increase production cuts. Furthermore, how OPEC+ (i.e. mainly Russia) agree to take part in any further cuts.
Volatility remains significant on Wall Street with another huge session, this time higher, helped by the strong showing of the continuity candidate Joe Biden in “Super Tuesday”. The S&P 500 jumped +4.2% to 3130. However, the volatility shows little sign of calming down, with US futures sharply back lower again today, by -0.9%. Asian markets have felt the benefit of a strong close on Wall Street, with the Nikkei +1.1% and Shanghai Composite +2.0%. European futures are pointing to gains in early moves today with FTSE futures 0.5% and DAX futures +0.7%, however, given the direction of futures in the US, gains may be restricted. In forex, there is a mixed outlook across majors. The signs of fatigue in the EUR rally continue, whilst JPY is performing well. CAD remains under pressure following the larger than expected rate cut from the Bank of Canada. In commodities, gold continues its consolidation from yesterday, whilst oil is ticking back higher as OPEC meets today.
The economic calendar is mainly reserved for US data today. The Weekly Jobless Claims at 1330GMT are expected to once more remain around recent levels, with 215,000 (from 219,000 last week). The US Factory Orders at 1500GMT are expected to show a -0.1% decline on the month of January (following a +1.8% increase in December).
There are a couple of central bank chiefs on the agenda to keep an eye out for. First of all the outgoing governor of the Bank of England, Mark Carney is speaking at 1700GMT, whilst the Bank of Canada’s Governor Stephen Poloz talks about “economic progress” at 1745GMT.
Chart of the Day – Brent Crude Oil
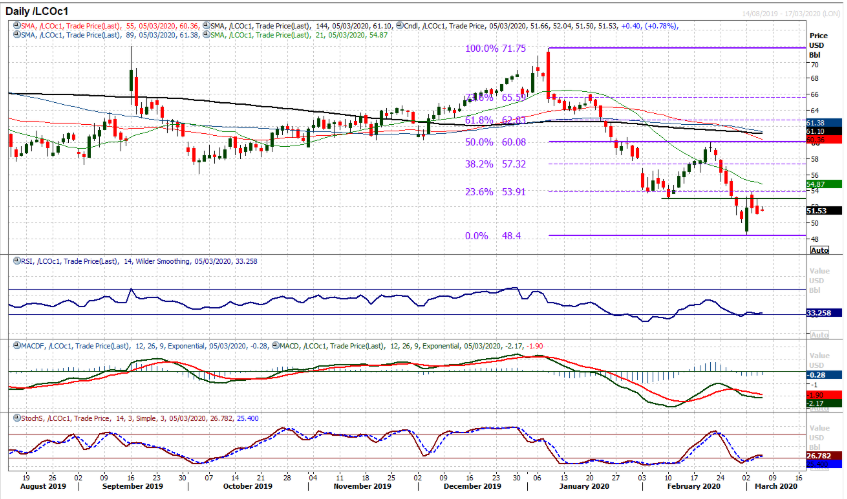
As the OPEC+ countries discuss the prospect of production cuts in the next couple of days, the outlook for Brent Crude comes into focus. The technicals show a big bullish engulfing candlestick (bullish key one day reversal) on Monday has given the market an improving skew. However, despite this, the initial rally has failed to follow through and there has been a stumbling of the rally around resistance. An intraday failure on Tuesday around the 23.6% Fibonacci retracement (of $71.75/$48.40) at $53.90 has yet to be overcome, whilst yesterday’s intraday rebound failed around the $53.10 old February low. This leaves a resistance band $53.10/$53.90 which will be a gauge for the recovery. Momentum indicators are gradually improving following a Stochastics bull cross to move above 20 and RSI crossing back above 30. However, yesterday’s negative candle suggests the market is concerned that OPEC+ will be unable to deliver the necessary cuts. Technical reaction to the fundamental/newsflow event will turn bullish above $53.90. The hourly chart shows a higher low at $49.90 above the key $48.40 low, with a tick higher this morning. Initial support at $51.00 the bulls will be keen to protect now, whilst $53.00 is a basis of resistance.

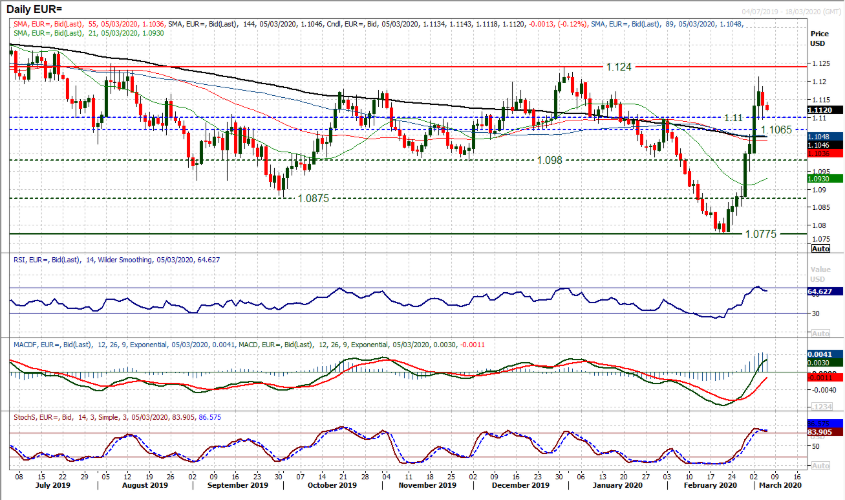
The strong run higher on EUR/USD came as the market quickly priced in a series of Fed rate cuts. However, now the FOMC has made the emergency -50bps cut (and more cuts are priced in already), could there be the prospect of some profit-taking? We discussed this potential yesterday and subsequently the market did start to show signs of stalling in the rally. A negative candle resulted. However, the bulls are still hanging on this morning. A second test of the old pivot at $1.1100 held into the close yesterday and the market is now building consolidation. We note that the RSI has turned back from a position above 70, something that is seen as an extreme move on EUR/USD, whilst Stochastics are also showing signs of fatigue. The hourly chart positive momentum has also lost its spark as slight negative divergences have begun to weigh. The key move to trigger a correction would be a close back below $1.1095, which would open another retracement again.
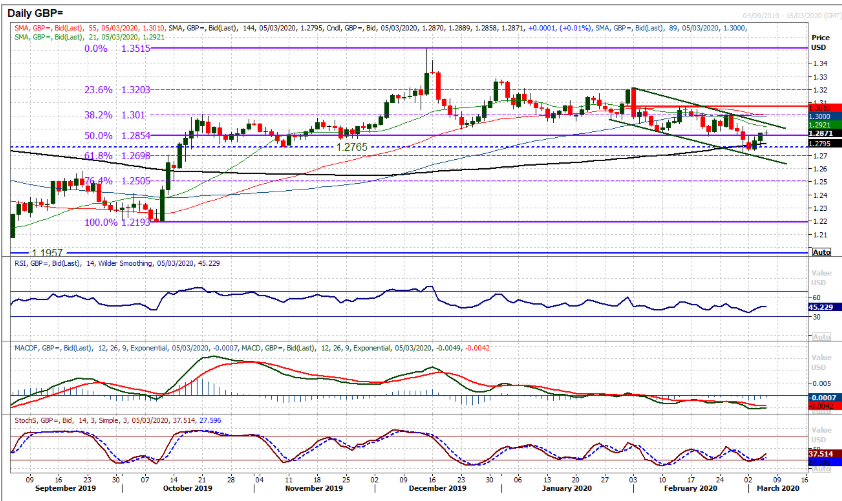
The selling pressure through Cable has just begun to stabilize in the past 48 hours or so. This comes as Friday’s multi-month low at $1.2725 has remained intact through the first half of the week. However, this could simply just be the early moves of another near term technical rally on Cable that runs counter to what is now a corrective outlook. Running lower highs and lower lows which have been breaking through a series of key supports in recent weeks have left the sterling bulls bruised. Although they have not had the knockout blow of trading what can still be argued to be a four to five month range, here is increasingly an outlook of selling into strength on Cable now. This would suggest that how this technical rally manifests in the coming days would be another opportunity to sell for a decisive move clear below the November low. A move above $1.2845 initially improves the outlook and opens for a +100/+120 pip rally. The Fibonacci retracements (of $1.2193/$1.3515) play a key role here. Initially the 50% Fib retracement at $1.2850 has been breached which opens the 38.2% Fib level at $1.3010 which also marks around the first key lower high. However, bear market rallies tend to undershoot their recovery targets. We would expect a technical rally to falter around $1.2950 between these Fib levels and be a chance to sell.

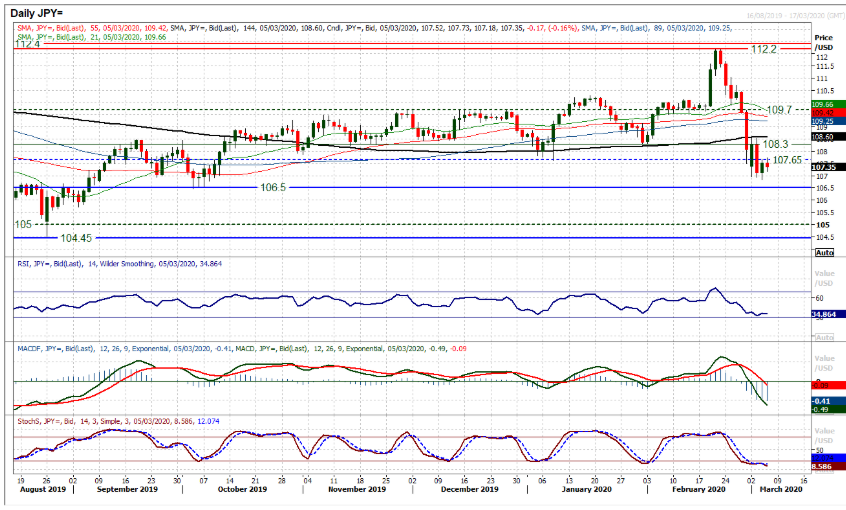
Yesterday had a relatively move settled session to calm some of the recent significant volatility on Dollar/Yen. There is still a corrective outlook, given the tick back lower once more this morning, but the selling momentum has become notable less significant in the past 24 hours and this could be a point at which the dollar bulls begin to rebuild once more. The past three sessions have seen support arriving between 106.85/106.95 and it is interesting to see the RSI holding around the low 30s. The bulls resumed control in the lows 30s during two corrections of January. However, the bulls have their work cut out for a recovery. The resistance is growing at 108.55 and is a point that needs to be overcome to entertain the prospect of a recovery. Initial resistance has also come around the old January low and means 107.65/107.75 is a barrier today. A close under 107.00 would continue the move lower, with 106.50 as next key support.

Gold
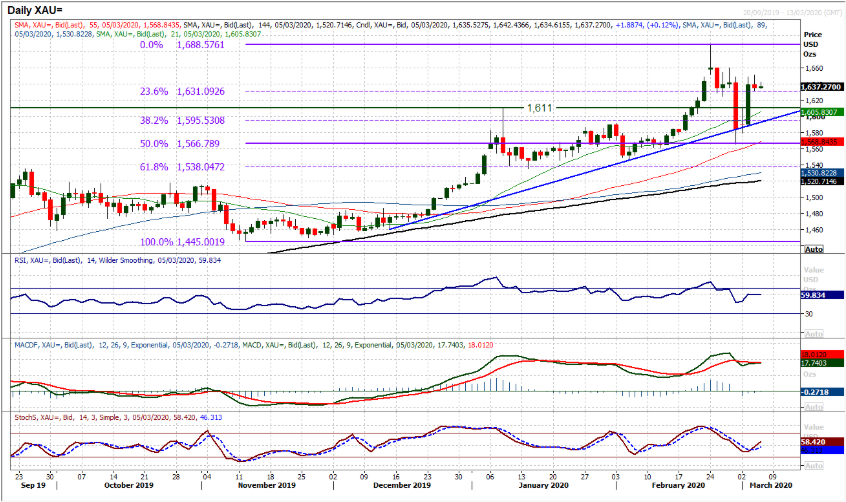
The sharp rebound on gold was met with a bout of consolidation yesterday as the market took pause for breath. Spending the session, fluctuating between gains and losses, a small negative candle has just curbed some of the bullish intent for now. We discussed yesterday how the 23.6% Fibonacci retracement was being used as a basis of support (around $1631) prior to the sharp sell-off last Friday. We note with interest how once more, this is being used as a basis of support. Given how volatile markets have been recently, it is difficult to say with high conviction that gold will certainly be moving higher, but we believe the medium term positive outlook for gold remains intact on the technicals (as it does on fundamentals) and as such we see weakness as a chance to buy. The eleven week uptrend is supportive at $1592 today (around the 38.2% Fib at $1595). Momentum indicators are ticking positively once more, within their positive medium term configuration. The resistance to overcome to engage high conviction in the move higher again comes in at $1651/$1660. Another higher low above the old $1611 breakout would be positive.

WTI Oil
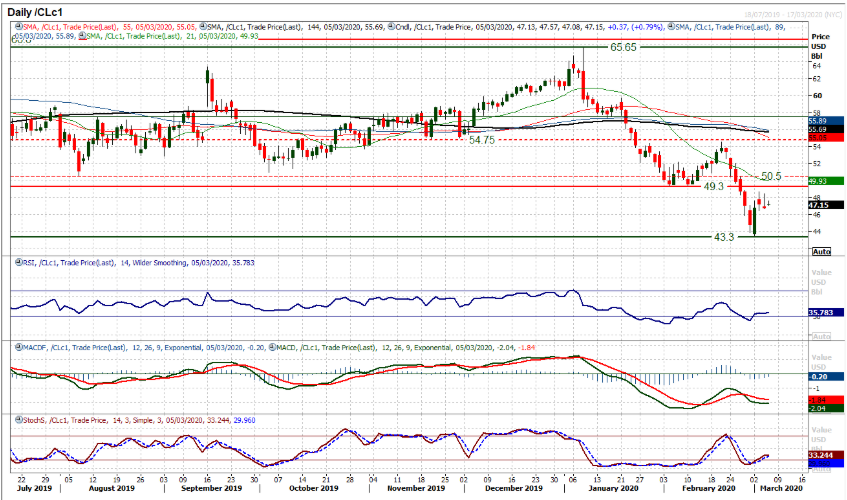
Oil has just begun to consolidate in the past couple of days, but the legacy of the bullish outside day session from Monday remains a feature of the near term outlook. It lends the prospect of recovery to WTI. However, resistance is forming at $48.65 under the old $49.30/$50.50 overhead supply. So there is a considerable barrier to overcome in a recovery scenario. Momentum indicators are tentatively ticking higher with RSI continuing to move back above 30 and a similar look to the Stochastics. The bulls need to hold on to the recovery at $46.45 now, as hourly signals consolidate into the OPEC+ meetings of the next couple of days. How WTI emerges from the next two days of trading could be crucial for the outlook. A failed rally with a move back under $46.45 would re-open the $43.30 low. A close back above $49.30 would really improve the outlook. Yesterday’s near doji daily candle reflects the near term uncertainty.

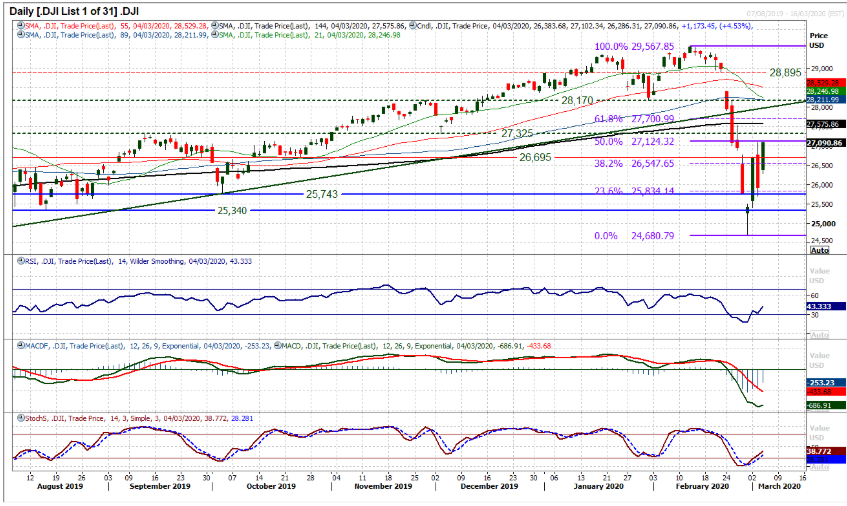
Another day, another huge candle on the Dow. Even though the daily range was just over 800 ticks, with a gap higher at the open before the strong close, the Dow posted its second largest points gain ever at +1173. The move just continues the enormous daily moves seen on Wall Street over the past 8 sessions. The Dow has now closed a gap at 26,890 and, at least for now, technical signals are pointing towards a recovery. Stochastics rising back above 20, with RSI making its way higher back above 40. The hourly chart shows a rally advancing with higher lows and higher highs now. The support down around 25,700 is a key higher low in the recovery now. The bulls now need to move through resistance at 27,325/27,540 for the next leg in the recovery. A key gauge of how this recovery develops will also be how the bulls respond to weakness now. They look set to be tested today with futures suggesting an initial move back lower early today. Initial support around 26,700/26,775 could quickly be tested
"""DISCLAIMER: This report does not constitute personal investment advice, nor does it take into account the individual financial circumstances or objectives of the clients who receive it. All information and research produced by Hantec Markets is intended to be general in nature; it does not constitute a recommendation or offer for the purchase or sale of any financial instrument, nor should it be construed as such.
All of the views or suggestions within this report are those solely and exclusively of the author, and accurately reflect his personal views about any and all of the subject instruments and are presented to the best of the author’s knowledge. Any person relying on this report to undertake trading does so entirely at his/her own risk and Hantec Markets does not accept any liability. """
Market Overview
In an attempt to try and mitigate the economic impact of Coronavirus, global central banks seem to be acting in coordination. Rate cuts from major central banks such as the Federal Reserve, Reserve Bank of Australia and now Bank of Canada have been seen in recent days. Attention will be on whether the ECB and the Bank of England also follow suit. The question is whether a monetary policy response to a supply-side shock is the right move. It needs to come in conjunction with a fiscal response from governments, and it is beginning to now come. The supra-national body, the IMF has pledged $50bn of support to low-income countries, whilst in China there will be a package of 100bn yuan (c. $16bn) for its own coronavirus prevention. As for markets, there has been an element of stabilization on bond yields in the past 24 hours, with the US 10 year yield back above 1.00% again, helping the dollar to steady. Forex majors seen to be relatively settled this morning, at least relative to the huge volatility of recent sessions. Focus for oil traders today will be on how talks between OPEC members decide to increase production cuts. Furthermore, how OPEC+ (i.e. mainly Russia) agree to take part in any further cuts.
Volatility remains significant on Wall Street with another huge session, this time higher, helped by the strong showing of the continuity candidate Joe Biden in “Super Tuesday”. The S&P 500 jumped +4.2% to 3130. However, the volatility shows little sign of calming down, with US futures sharply back lower again today, by -0.9%. Asian markets have felt the benefit of a strong close on Wall Street, with the Nikkei +1.1% and Shanghai Composite +2.0%. European futures are pointing to gains in early moves today with FTSE futures 0.5% and DAX futures +0.7%, however, given the direction of futures in the US, gains may be restricted. In forex, there is a mixed outlook across majors. The signs of fatigue in the EUR rally continue, whilst JPY is performing well. CAD remains under pressure following the larger than expected rate cut from the Bank of Canada. In commodities, gold continues its consolidation from yesterday, whilst oil is ticking back higher as OPEC meets today.
The economic calendar is mainly reserved for US data today. The Weekly Jobless Claims at 1330GMT are expected to once more remain around recent levels, with 215,000 (from 219,000 last week). The US Factory Orders at 1500GMT are expected to show a -0.1% decline on the month of January (following a +1.8% increase in December).
There are a couple of central bank chiefs on the agenda to keep an eye out for. First of all the outgoing governor of the Bank of England, Mark Carney is speaking at 1700GMT, whilst the Bank of Canada’s Governor Stephen Poloz talks about “economic progress” at 1745GMT.
Chart of the Day – Brent Crude Oil
As the OPEC+ countries discuss the prospect of production cuts in the next couple of days, the outlook for Brent Crude comes into focus. The technicals show a big bullish engulfing candlestick (bullish key one day reversal) on Monday has given the market an improving skew. However, despite this, the initial rally has failed to follow through and there has been a stumbling of the rally around resistance. An intraday failure on Tuesday around the 23.6% Fibonacci retracement (of $71.75/$48.40) at $53.90 has yet to be overcome, whilst yesterday’s intraday rebound failed around the $53.10 old February low. This leaves a resistance band $53.10/$53.90 which will be a gauge for the recovery. Momentum indicators are gradually improving following a Stochastics bull cross to move above 20 and RSI crossing back above 30. However, yesterday’s negative candle suggests the market is concerned that OPEC+ will be unable to deliver the necessary cuts. Technical reaction to the fundamental/newsflow event will turn bullish above $53.90. The hourly chart shows a higher low at $49.90 above the key $48.40 low, with a tick higher this morning. Initial support at $51.00 the bulls will be keen to protect now, whilst $53.00 is a basis of resistance.

The strong run higher on EUR/USD came as the market quickly priced in a series of Fed rate cuts. However, now the FOMC has made the emergency -50bps cut (and more cuts are priced in already), could there be the prospect of some profit-taking? We discussed this potential yesterday and subsequently the market did start to show signs of stalling in the rally. A negative candle resulted. However, the bulls are still hanging on this morning. A second test of the old pivot at $1.1100 held into the close yesterday and the market is now building consolidation. We note that the RSI has turned back from a position above 70, something that is seen as an extreme move on EUR/USD, whilst Stochastics are also showing signs of fatigue. The hourly chart positive momentum has also lost its spark as slight negative divergences have begun to weigh. The key move to trigger a correction would be a close back below $1.1095, which would open another retracement again.

The selling pressure through Cable has just begun to stabilize in the past 48 hours or so. This comes as Friday’s multi-month low at $1.2725 has remained intact through the first half of the week. However, this could simply just be the early moves of another near term technical rally on Cable that runs counter to what is now a corrective outlook. Running lower highs and lower lows which have been breaking through a series of key supports in recent weeks have left the sterling bulls bruised. Although they have not had the knockout blow of trading what can still be argued to be a four to five month range, here is increasingly an outlook of selling into strength on Cable now. This would suggest that how this technical rally manifests in the coming days would be another opportunity to sell for a decisive move clear below the November low. A move above $1.2845 initially improves the outlook and opens for a +100/+120 pip rally. The Fibonacci retracements (of $1.2193/$1.3515) play a key role here. Initially the 50% Fib retracement at $1.2850 has been breached which opens the 38.2% Fib level at $1.3010 which also marks around the first key lower high. However, bear market rallies tend to undershoot their recovery targets. We would expect a technical rally to falter around $1.2950 between these Fib levels and be a chance to sell.

Yesterday had a relatively move settled session to calm some of the recent significant volatility on Dollar/Yen. There is still a corrective outlook, given the tick back lower once more this morning, but the selling momentum has become notable less significant in the past 24 hours and this could be a point at which the dollar bulls begin to rebuild once more. The past three sessions have seen support arriving between 106.85/106.95 and it is interesting to see the RSI holding around the low 30s. The bulls resumed control in the lows 30s during two corrections of January. However, the bulls have their work cut out for a recovery. The resistance is growing at 108.55 and is a point that needs to be overcome to entertain the prospect of a recovery. Initial resistance has also come around the old January low and means 107.65/107.75 is a barrier today. A close under 107.00 would continue the move lower, with 106.50 as next key support.
Gold
The sharp rebound on gold was met with a bout of consolidation yesterday as the market took pause for breath. Spending the session, fluctuating between gains and losses, a small negative candle has just curbed some of the bullish intent for now. We discussed yesterday how the 23.6% Fibonacci retracement was being used as a basis of support (around $1631) prior to the sharp sell-off last Friday. We note with interest how once more, this is being used as a basis of support. Given how volatile markets have been recently, it is difficult to say with high conviction that gold will certainly be moving higher, but we believe the medium term positive outlook for gold remains intact on the technicals (as it does on fundamentals) and as such we see weakness as a chance to buy. The eleven week uptrend is supportive at $1592 today (around the 38.2% Fib at $1595). Momentum indicators are ticking positively once more, within their positive medium term configuration. The resistance to overcome to engage high conviction in the move higher again comes in at $1651/$1660. Another higher low above the old $1611 breakout would be positive.
WTI Oil
Oil has just begun to consolidate in the past couple of days, but the legacy of the bullish outside day session from Monday remains a feature of the near term outlook. It lends the prospect of recovery to WTI. However, resistance is forming at $48.65 under the old $49.30/$50.50 overhead supply. So there is a considerable barrier to overcome in a recovery scenario. Momentum indicators are tentatively ticking higher with RSI continuing to move back above 30 and a similar look to the Stochastics. The bulls need to hold on to the recovery at $46.45 now, as hourly signals consolidate into the OPEC+ meetings of the next couple of days. How WTI emerges from the next two days of trading could be crucial for the outlook. A failed rally with a move back under $46.45 would re-open the $43.30 low. A close back above $49.30 would really improve the outlook. Yesterday’s near doji daily candle reflects the near term uncertainty.
Another day, another huge candle on the Dow. Even though the daily range was just over 800 ticks, with a gap higher at the open before the strong close, the Dow posted its second largest points gain ever at +1173. The move just continues the enormous daily moves seen on Wall Street over the past 8 sessions. The Dow has now closed a gap at 26,890 and, at least for now, technical signals are pointing towards a recovery. Stochastics rising back above 20, with RSI making its way higher back above 40. The hourly chart shows a rally advancing with higher lows and higher highs now. The support down around 25,700 is a key higher low in the recovery now. The bulls now need to move through resistance at 27,325/27,540 for the next leg in the recovery. A key gauge of how this recovery develops will also be how the bulls respond to weakness now. They look set to be tested today with futures suggesting an initial move back lower early today. Initial support around 26,700/26,775 could quickly be tested

"""DISCLAIMER: This report does not constitute personal investment advice, nor does it take into account the individual financial circumstances or objectives of the clients who receive it. All information and research produced by Hantec Markets is intended to be general in nature; it does not constitute a recommendation or offer for the purchase or sale of any financial instrument, nor should it be construed as such.
All of the views or suggestions within this report are those solely and exclusively of the author, and accurately reflect his personal views about any and all of the subject instruments and are presented to the best of the author’s knowledge. Any person relying on this report to undertake trading does so entirely at his/her own risk and Hantec Markets does not accept any liability. """
In an attempt to try and mitigate the economic impact of Coronavirus, global central banks seem to be acting in coordination. Rate cuts from major central banks such as the Federal Reserve, Reserve Bank of Australia and now Bank of Canada have been seen in recent days. Attention will be on whether the ECB and the Bank of England also follow suit. The question is whether a monetary policy response to a supply-side shock is the right move. It needs to come in conjunction with a fiscal response from governments, and it is beginning to now come. The supra-national body, the IMF has pledged $50bn of support to low-income countries, whilst in China there will be a package of 100bn yuan (c. $16bn) for its own coronavirus prevention. As for markets, there has been an element of stabilization on bond yields in the past 24 hours, with the US 10 year yield back above 1.00% again, helping the dollar to steady. Forex majors seen to be relatively settled this morning, at least relative to the huge volatility of recent sessions. Focus for oil traders today will be on how talks between OPEC members decide to increase production cuts. Furthermore, how OPEC+ (i.e. mainly Russia) agree to take part in any further cuts.
Volatility remains significant on Wall Street with another huge session, this time higher, helped by the strong showing of the continuity candidate Joe Biden in “Super Tuesday”. The S&P 500 jumped +4.2% to 3130. However, the volatility shows little sign of calming down, with US futures sharply back lower again today, by -0.9%. Asian markets have felt the benefit of a strong close on Wall Street, with the Nikkei +1.1% and Shanghai Composite +2.0%. European futures are pointing to gains in early moves today with FTSE futures 0.5% and DAX futures +0.7%, however, given the direction of futures in the US, gains may be restricted. In forex, there is a mixed outlook across majors. The signs of fatigue in the EUR rally continue, whilst JPY is performing well. CAD remains under pressure following the larger than expected rate cut from the Bank of Canada. In commodities, gold continues its consolidation from yesterday, whilst oil is ticking back higher as OPEC meets today.
The economic calendar is mainly reserved for US data today. The Weekly Jobless Claims at 1330GMT are expected to once more remain around recent levels, with 215,000 (from 219,000 last week). The US Factory Orders at 1500GMT are expected to show a -0.1% decline on the month of January (following a +1.8% increase in December).
There are a couple of central bank chiefs on the agenda to keep an eye out for. First of all the outgoing governor of the Bank of England, Mark Carney is speaking at 1700GMT, whilst the Bank of Canada’s Governor Stephen Poloz talks about “economic progress” at 1745GMT.
Chart of the Day – Brent Crude Oil
As the OPEC+ countries discuss the prospect of production cuts in the next couple of days, the outlook for Brent Crude comes into focus. The technicals show a big bullish engulfing candlestick (bullish key one day reversal) on Monday has given the market an improving skew. However, despite this, the initial rally has failed to follow through and there has been a stumbling of the rally around resistance. An intraday failure on Tuesday around the 23.6% Fibonacci retracement (of $71.75/$48.40) at $53.90 has yet to be overcome, whilst yesterday’s intraday rebound failed around the $53.10 old February low. This leaves a resistance band $53.10/$53.90 which will be a gauge for the recovery. Momentum indicators are gradually improving following a Stochastics bull cross to move above 20 and RSI crossing back above 30. However, yesterday’s negative candle suggests the market is concerned that OPEC+ will be unable to deliver the necessary cuts. Technical reaction to the fundamental/newsflow event will turn bullish above $53.90. The hourly chart shows a higher low at $49.90 above the key $48.40 low, with a tick higher this morning. Initial support at $51.00 the bulls will be keen to protect now, whilst $53.00 is a basis of resistance.
The strong run higher on EUR/USD came as the market quickly priced in a series of Fed rate cuts. However, now the FOMC has made the emergency -50bps cut (and more cuts are priced in already), could there be the prospect of some profit-taking? We discussed this potential yesterday and subsequently the market did start to show signs of stalling in the rally. A negative candle resulted. However, the bulls are still hanging on this morning. A second test of the old pivot at $1.1100 held into the close yesterday and the market is now building consolidation. We note that the RSI has turned back from a position above 70, something that is seen as an extreme move on EUR/USD, whilst Stochastics are also showing signs of fatigue. The hourly chart positive momentum has also lost its spark as slight negative divergences have begun to weigh. The key move to trigger a correction would be a close back below $1.1095, which would open another retracement again.

The selling pressure through Cable has just begun to stabilize in the past 48 hours or so. This comes as Friday’s multi-month low at $1.2725 has remained intact through the first half of the week. However, this could simply just be the early moves of another near term technical rally on Cable that runs counter to what is now a corrective outlook. Running lower highs and lower lows which have been breaking through a series of key supports in recent weeks have left the sterling bulls bruised. Although they have not had the knockout blow of trading what can still be argued to be a four to five month range, here is increasingly an outlook of selling into strength on Cable now. This would suggest that how this technical rally manifests in the coming days would be another opportunity to sell for a decisive move clear below the November low. A move above $1.2845 initially improves the outlook and opens for a +100/+120 pip rally. The Fibonacci retracements (of $1.2193/$1.3515) play a key role here. Initially the 50% Fib retracement at $1.2850 has been breached which opens the 38.2% Fib level at $1.3010 which also marks around the first key lower high. However, bear market rallies tend to undershoot their recovery targets. We would expect a technical rally to falter around $1.2950 between these Fib levels and be a chance to sell.
Yesterday had a relatively move settled session to calm some of the recent significant volatility on Dollar/Yen. There is still a corrective outlook, given the tick back lower once more this morning, but the selling momentum has become notable less significant in the past 24 hours and this could be a point at which the dollar bulls begin to rebuild once more. The past three sessions have seen support arriving between 106.85/106.95 and it is interesting to see the RSI holding around the low 30s. The bulls resumed control in the lows 30s during two corrections of January. However, the bulls have their work cut out for a recovery. The resistance is growing at 108.55 and is a point that needs to be overcome to entertain the prospect of a recovery. Initial resistance has also come around the old January low and means 107.65/107.75 is a barrier today. A close under 107.00 would continue the move lower, with 106.50 as next key support.

Gold
The sharp rebound on gold was met with a bout of consolidation yesterday as the market took pause for breath. Spending the session, fluctuating between gains and losses, a small negative candle has just curbed some of the bullish intent for now. We discussed yesterday how the 23.6% Fibonacci retracement was being used as a basis of support (around $1631) prior to the sharp sell-off last Friday. We note with interest how once more, this is being used as a basis of support. Given how volatile markets have been recently, it is difficult to say with high conviction that gold will certainly be moving higher, but we believe the medium term positive outlook for gold remains intact on the technicals (as it does on fundamentals) and as such we see weakness as a chance to buy. The eleven week uptrend is supportive at $1592 today (around the 38.2% Fib at $1595). Momentum indicators are ticking positively once more, within their positive medium term configuration. The resistance to overcome to engage high conviction in the move higher again comes in at $1651/$1660. Another higher low above the old $1611 breakout would be positive.

WTI Oil
Oil has just begun to consolidate in the past couple of days, but the legacy of the bullish outside day session from Monday remains a feature of the near term outlook. It lends the prospect of recovery to WTI. However, resistance is forming at $48.65 under the old $49.30/$50.50 overhead supply. So there is a considerable barrier to overcome in a recovery scenario. Momentum indicators are tentatively ticking higher with RSI continuing to move back above 30 and a similar look to the Stochastics. The bulls need to hold on to the recovery at $46.45 now, as hourly signals consolidate into the OPEC+ meetings of the next couple of days. How WTI emerges from the next two days of trading could be crucial for the outlook. A failed rally with a move back under $46.45 would re-open the $43.30 low. A close back above $49.30 would really improve the outlook. Yesterday’s near doji daily candle reflects the near term uncertainty.

Another day, another huge candle on the Dow. Even though the daily range was just over 800 ticks, with a gap higher at the open before the strong close, the Dow posted its second largest points gain ever at +1173. The move just continues the enormous daily moves seen on Wall Street over the past 8 sessions. The Dow has now closed a gap at 26,890 and, at least for now, technical signals are pointing towards a recovery. Stochastics rising back above 20, with RSI making its way higher back above 40. The hourly chart shows a rally advancing with higher lows and higher highs now. The support down around 25,700 is a key higher low in the recovery now. The bulls now need to move through resistance at 27,325/27,540 for the next leg in the recovery. A key gauge of how this recovery develops will also be how the bulls respond to weakness now. They look set to be tested today with futures suggesting an initial move back lower early today. Initial support around 26,700/26,775 could quickly be tested

"""DISCLAIMER: This report does not constitute personal investment advice, nor does it take into account the individual financial circumstances or objectives of the clients who receive it. All information and research produced by Hantec Markets is intended to be general in nature; it does not constitute a recommendation or offer for the purchase or sale of any financial instrument, nor should it be construed as such.
All of the views or suggestions within this report are those solely and exclusively of the author, and accurately reflect his personal views about any and all of the subject instruments and are presented to the best of the author’s knowledge. Any person relying on this report to undertake trading does so entirely at his/her own risk and Hantec Markets does not accept any liability. """