Market Overview
There has been a lack of conviction on major markets which is taking over from the optimism that drove markets into last weekend. The cracks are beginning to show on the US/China agreement for “Phase 1” of their trade deal. Steve Mnuchin (US Treasury Sec) is talking about the December tariffs being enforced should a deal not be signed. This US administration continues to believe that the “stick” is a better approach rather than the “carrot”. Further negotiations could also take place in the coming weeks ahead of the APEC summit in November when a prospective deal could be agreed. However, it leaves traders with a sense of uncertainty. Not having a steer from US bond markets yesterday (due to Columbus Day) will not have helped either, so perhaps more direction will be found today.
Playing a bit of catch up, Treasury yields have dropped early today and this is acting as a mild drag on the dollar. Subsequently there has been little traction so far this week as markets have started with an early consolidation. Adding to the sense of uncertainty, last week’s sudden optimism of a Brexit deal was pegged back by a degree of realism yesterday. Achieving an agreement will be incredibly tough still. Both sides have been relatively tight lipped (which is in itself a sign of progress) but time is not in abundance, with the EU Council meeting on Thursday/Friday looming. Can a deal be done with such a tight window? This morning, EU’s chief Brexit negotiator Michel Barnier has said that “a deal is still possible this week”. Sterling has jumped again, trading volatility remaining elevated and this hope of a deal is underpinning sterling. However, newsflow will be critical and the roller coaster ride is not over yet.
Wall Street closed a quiet session with the S&P 500 losing -0.1% at 2966 whilst US futures are more positive today, around +0.3% higher. Asian markets have been mixed but much due to the Nikkei playing catch up from yesterday’s public holiday +1.9% higher, whilst the Shanghai Composite was -0.6% lower. In Europe there is a slightly positive start to trading, with FTSE futures +0.2% and DAX futures +0.8%, the negative correlation of GBP and FTSE still showing clearly.
In forex, USD is slipping back as Treasury yields have dropped. GBP is the clear outperformer, whilst EUR also may be catching a bid on its coattails. In commodities there is a continued mixed outlook with a lack of traction, whilst oil is slipping back again as the bulls hit a wall yesterday.
UK wages and a crucial German survey dominate the economic calendar of the early European session. UK Unemployment is at 09:30 BST which is expected to remain at 3.8% again (3.8% in August) whilst the September claimant count is expected to be 26,500 (28,200 in August). UK Average Weekly Earnings growth is expected to also remain at +4.0% (+4.0% in August). The German ZEW Economic Sentiment for October is expected to deteriorate further to -27.0 (from -22.5 in September). US data is restricted to the New York Fed Manufacturing which is at 13:30 BST and is expected to slip marginally to +1.0 (from +2.0).
There are also some Fed speakers to keep an eye on, with dissenters everywhere. One of the two dissenting hawks, Esther George (voter, hawk) speaking at 17:45 BST, whilst the uber dove James Bullard (voter, dove) at 20:25 BST.
Chart of the Day – EUR/CHF
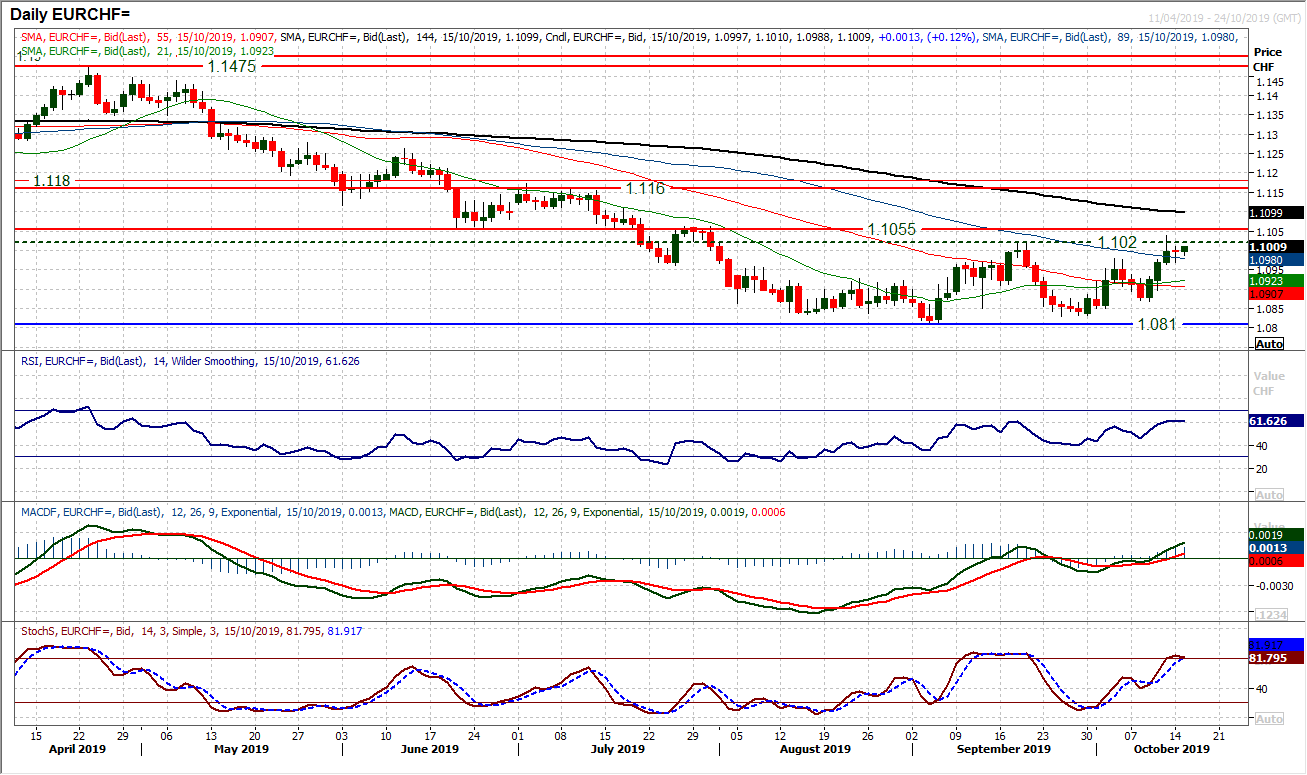
We have been looking at the improvement in the performance of the euro in recent weeks. This has also been the case against the Swiss franc, but an outlook changing breakout is yet to be seen. However the tide of selling with the market trending lower for several months, has at least been stemmed. Since August EUR/CHF has been building support in a consolidation pattern but that is threatening to turn higher now. Friday’s intraday breakout above 1.1020 could not be held into the close (which would have completed a base pattern), but the bulls are massing. Momentum indicators are far more positively configured now, with the MACD lines again pulling above neutral, whilst RSI oscillates between 40/60 which is at least neutral. The hourly chart shows a support band 1.0940/1.0975 and another higher low within this band will be a buying opportunity to play an improving outlook. A close above the old June/July pivot at 1.1055 would be confirmation of the base pattern that would imply a recovery target of 1.1210 in the coming months. Below 1.0895 aborts the recovery potential.
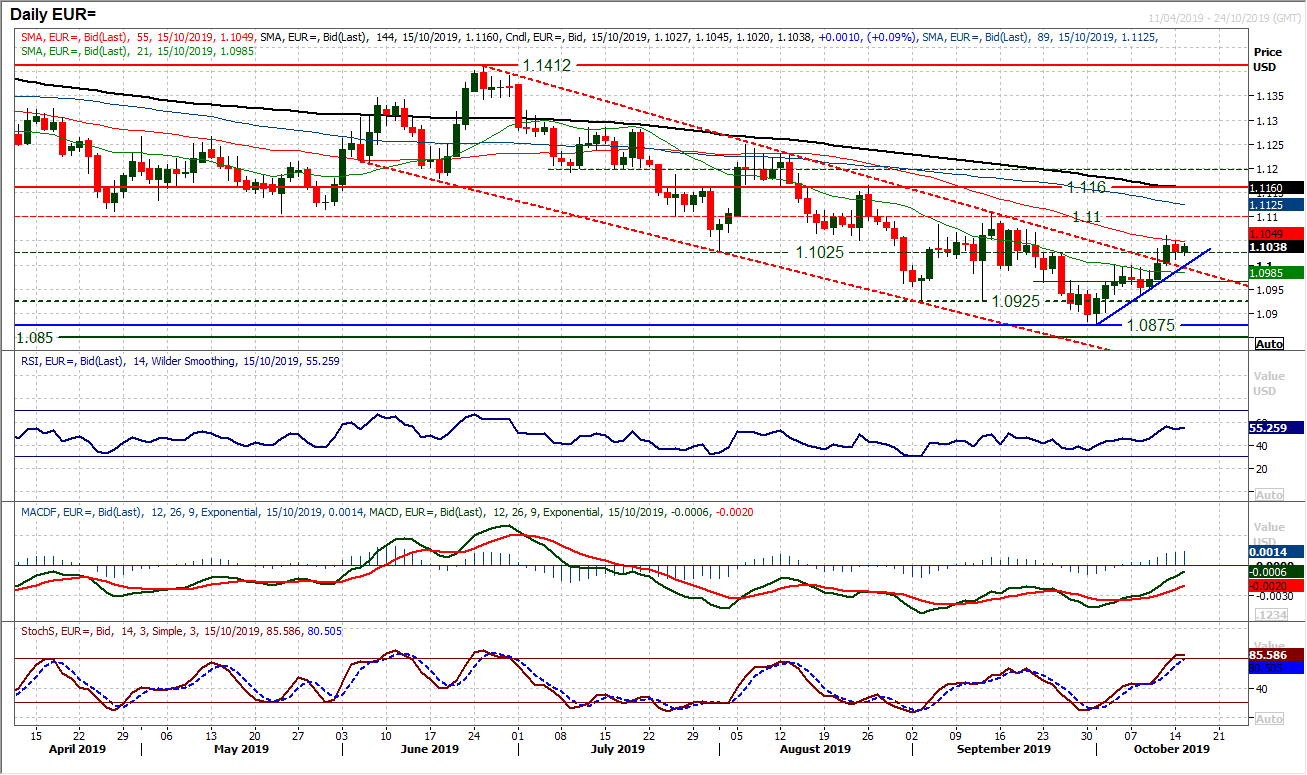
There has been a degree of caution in the wake of the conclusion of the US/China negotiations. However, it is interesting to see that the breakout above $1.1000/$1.1025 is something that the EUR/USD bulls can work from. There is an uptrend of the past two weeks which now rises at $1.1000 today and this is also a confluence with the old downtrend channel support. It comes with the market sustaining improving momentum indicators with the RSI still holding multi-month highs and MACD lines advancing. There is a new sense of optimism for EUR bulls now and the recent improvement is holding. Keeping a $1.10 handle is increasingly important now. The resistance at Friday’s reaction high of $1.1060 is restrictive but the bulls will know that $1.1100 is the first key resistance that this recovery needs to overcome now to be a sustainable move. Losing $1.1000 opens $1.0940.
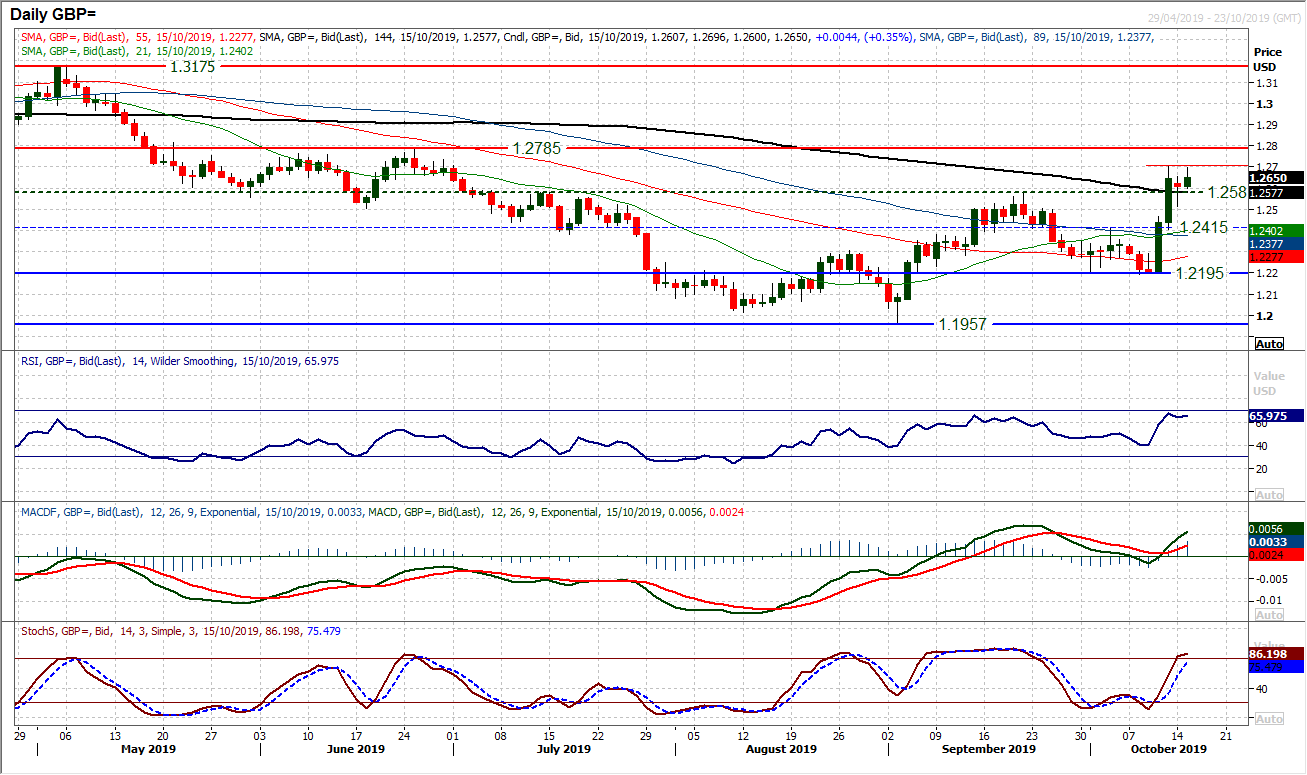
There is still a lot of uncertainty over how sustainable this move higher on sterling is. The improved prospects of a Brexit deal sent Cable soaring higher last week, but the uncertainty drove another volatile session yesterday. The likelihood is that this will continue throughout the week (lots of crucial UK political events, not to mention tier one data points too). Holding above the breakout at $1.2580 on a closing basis will have given the bulls encouragement. The market has been positive again this morning (on another positive hint from Barnier) whilst technical momentum signals continue to favour a positive bias, with the Stochastics looking strong, RSI in the mid-60s and MACD lines advancing above neutral. Yesterday’s reaction low adds to support between $1.2500/$1.2580 now. Politics will still be the main driver, but there is a positive bias coming into the European session today. Resistance is at $1.2705 and then more considerable at $1.2785, however, if the political ground shifts again, there will not be much respect for technicals.
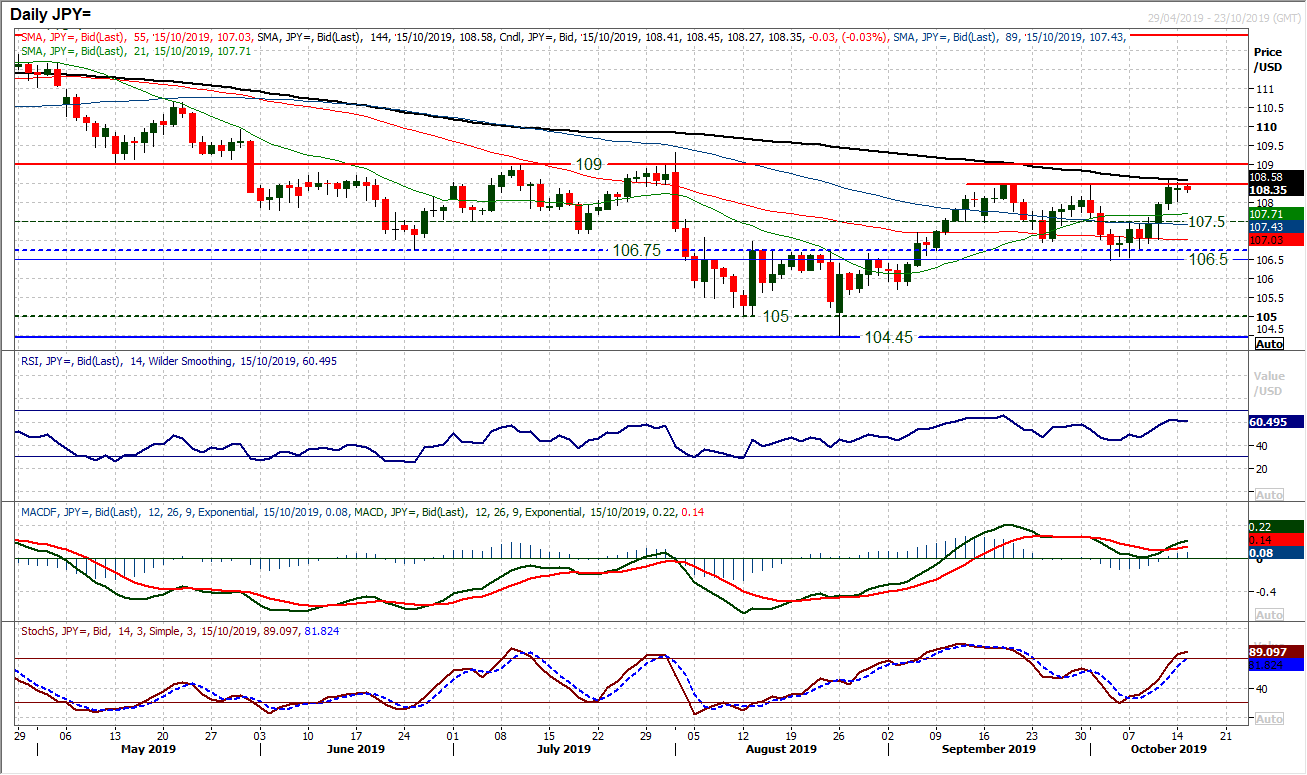
There is still a degree of uncertainty over the market reaction to the US/China mini trade deal, but it was interesting to see weakness on Dollar/Yen bought into yesterday. The safe haven yen did not make a big bounce back that would have come were the market to have had outright disappointment from the meeting. Subsequently, the resistance around 108.50 remains under pressure, having been tested again early this morning. A close above 108.50 would really open the way for a test of the key early summer pivot band 109.00. Looking at momentum indicators, the improvement seen through a MACD bull cross above neutral is just beginning to lose a little traction now, but the bulls are still well positioned to test resistance levels. There is a support in the band 107.75/108.00 now and the hourly chart shows RSI supported above 40 and MACD above neutral. Weakness is still a chance to buy.
Gold
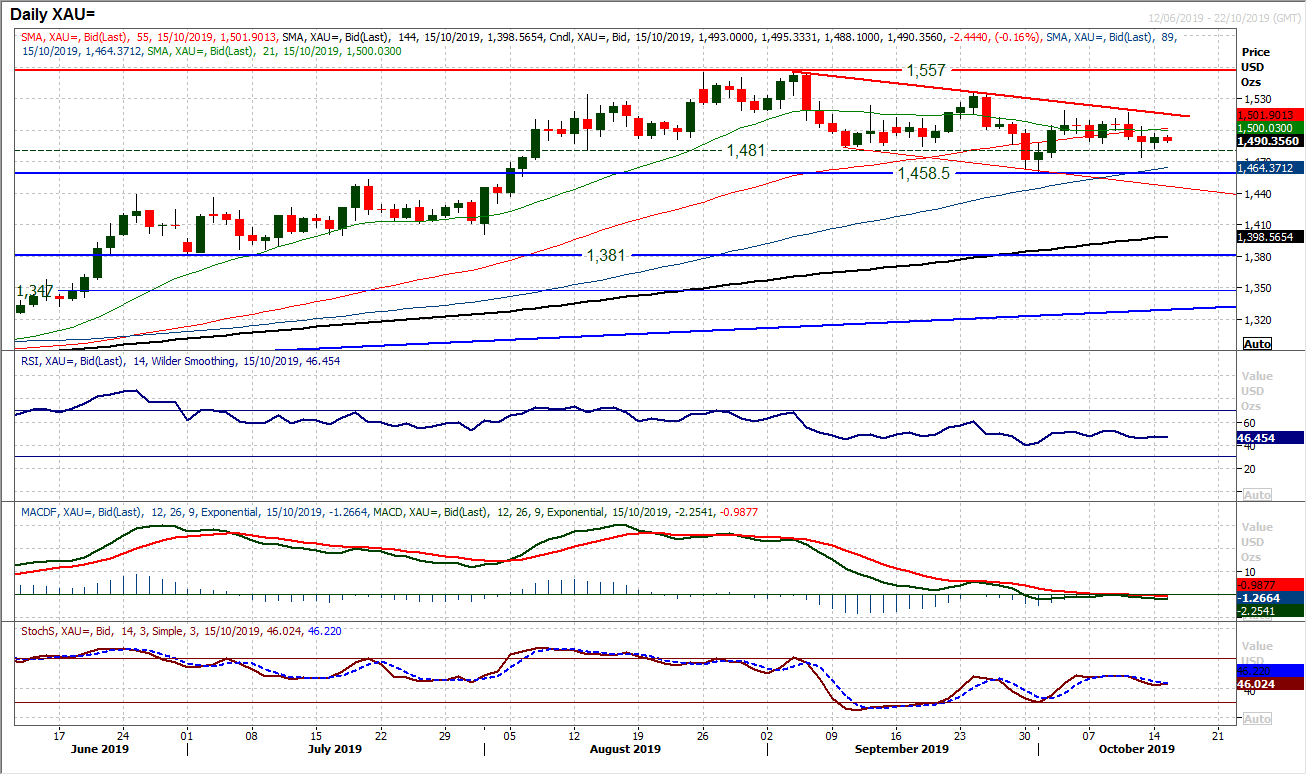
The bulls have not been blown away in a manner that had threatened on Friday prior to the conclusion of the US/China negotiations. Subsequently, there is an ongoing mixed outlook now for gold. Although there is a marginal negative bias that has come through following a break back under $1500, the lack of downside traction is still notable. Momentum indicators have just started to roll over and lean towards a mild negative bias as RSI, MACD and Stochastics edge below their neutral points. However, there is very little conviction in gold right now and the way the market picked up from $1474 on Friday (effectively from an old $1475 pivot) would suggest little control either way. Resistance is at $1504 before $1510 and then more considerably at $1518.50.
WTI Oil
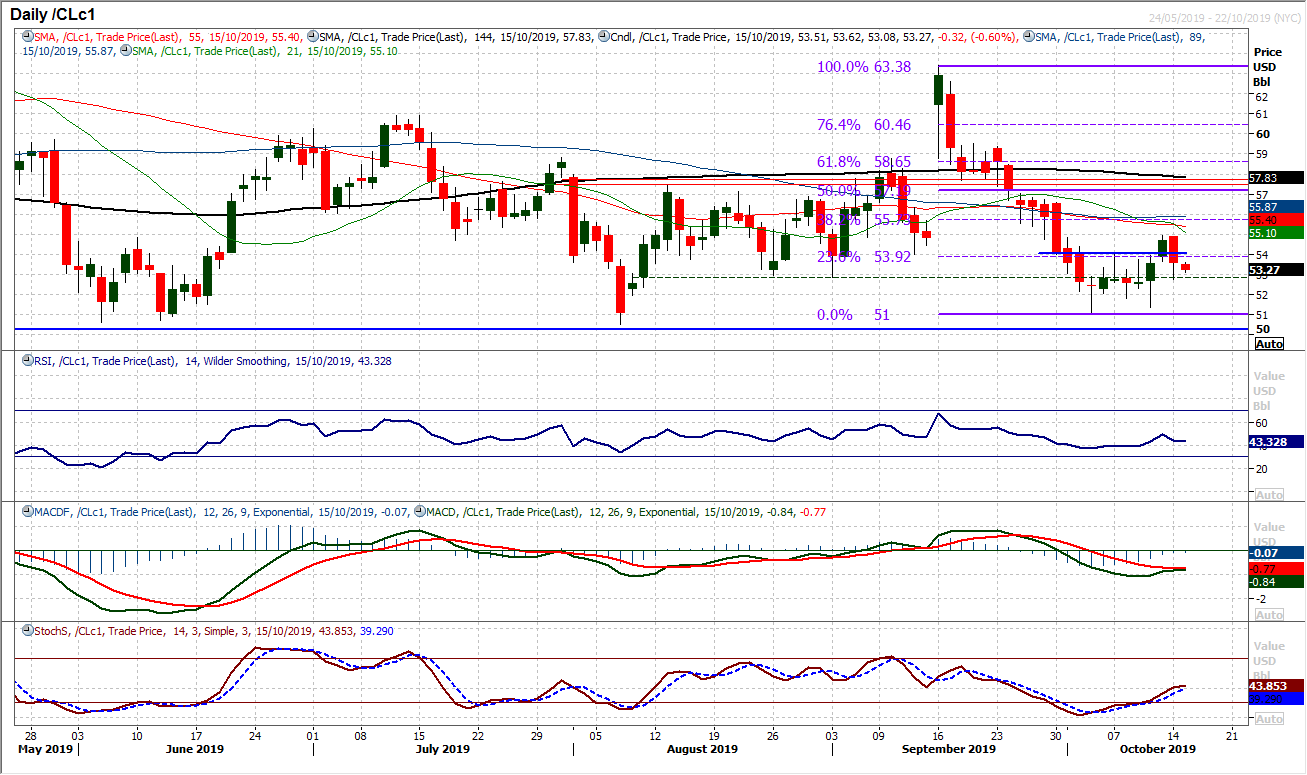
The prospect of a recovery took a juddering blow yesterday as a decisive corrective candlestick (a bearish engulfing) flipped the market on its head. Leaving resistance at $54.90 the market closed decisively back under the $53.90/$54.00 breakout support. With the market again lower today, there is a growing sense of bear control forming again. There has been an old pivot band around $52.80 which has been a good gauge for WTI in recent weeks (certainly on a closing basis). This is again a key gauge for market control. Momentum indicators turning over from the recoveries need to get back on track quickly. This pivot gauge at $52.80 could be key. A closing breach opens the key lows again around $50.50/$51.00.
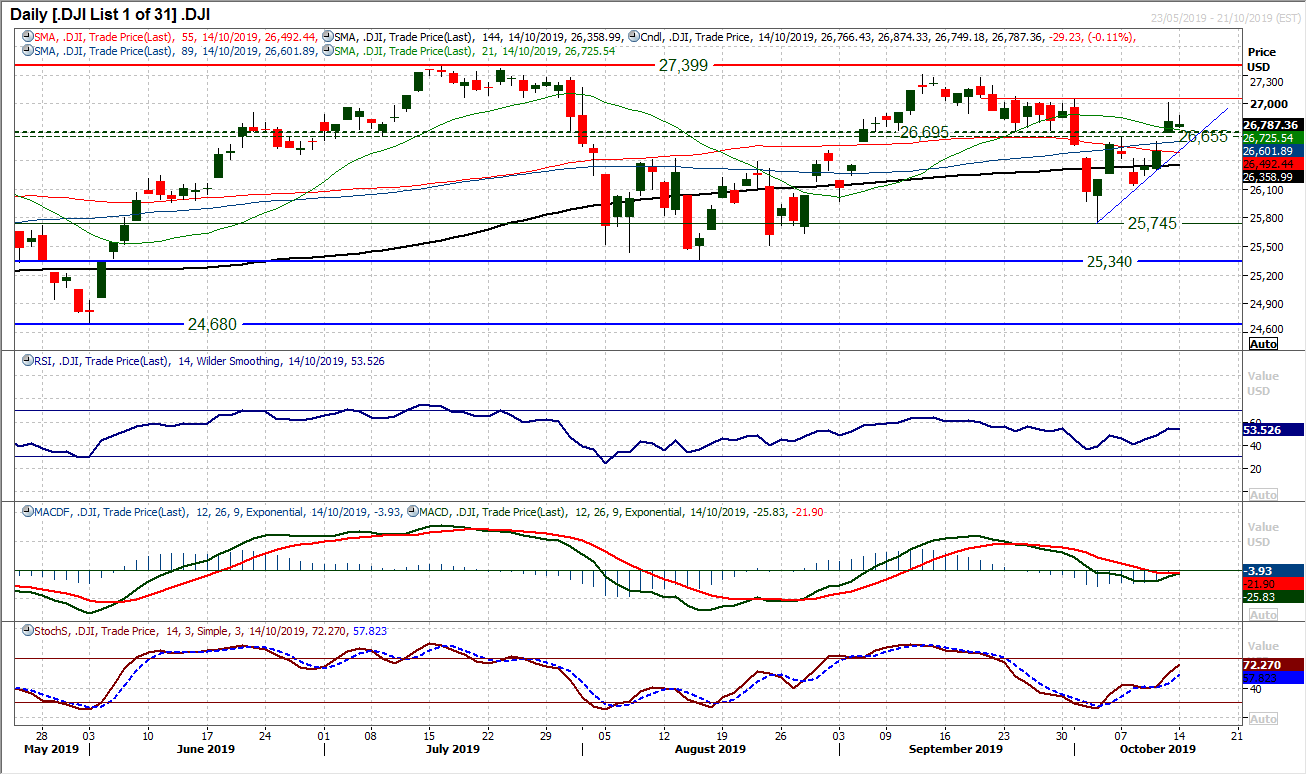
After Friday’s closing breakout above what is now becoming a pivot band 26,655/26,695, yesterday’s session was one of cautious consolidation. The absence of the bond markets would not have helped, but the Dow certainly lacked conviction yesterday. A small candlestick body and just 75 ticks of daily range (the Average True Range is currently 330 ticks) shows the lack of intent during yesterday’s session. The main takeaway was that the bulls are looking to build on support of the pivot now. Momentum indicators are showing a slight positive bias with Stochastics rising and RSI holding a shade above 50 (MACD lines are all but flat a shade under neutral). This is a market that need to continue to build above 26,655/26,695 support now. Resistance at 26,875 and more considerably 27,045/27,080.
"""DISCLAIMER: This report does not constitute personal investment advice, nor does it take into account the individual financial circumstances or objectives of the clients who receive it. All information and research produced by Hantec Markets is intended to be general in nature; it does not constitute a recommendation or offer for the purchase or sale of any financial instrument, nor should it be construed as such.
All of the views or suggestions within this report are those solely and exclusively of the author, and accurately reflect his personal views about any and all of the subject instruments and are presented to the best of the author’s knowledge. Any person relying on this report to undertake trading does so entirely at his/her own risk and Hantec Markets does not accept any liability. """
