Large-cap stocks offer long-term investors fundamentally sound companies that make their money work for them over the long haul without the hassle of constantly monitoring SEC filings, earnings and technical charts. These stocks are typically industry and sector leaders, representing well-established businesses with market capitalizations of $10 billion or more.
Two common characteristics of large-caps that make many of them optimal for avoiding high risk over the long-term: less volatility during rough markets and robust dividends. Several indices and benchmarks track large-cap companies, including the Dow Jones Industrial Average (DJI) (sometimes referred to as the Dow 30) and the S&P 500 (also known as the S&P).
For those looking to gain exposure to the wide range of large-cap stocks within the Dow, SPDR Dow Jones Industrial Average ETF (NYSE:DIA) is worth considering.
Why Invest In DIA?
As the oldest continuous barometer of the US stock market—created by Charles Dow in 1896—the Dow Jones Industrial Average is possibly the most widely-followed stock market index in the world. The SPDR Dow Jones Industrial Average ETF Trust serves as a proxy for the performance and the yield of the DJIA, which is comprised of 30 ''blue-chip'' US stocks listed on the New York Stock Exchange and the NASDAQ.
A blue-chip company is a large-cap market leader with a strong brand and often a long track record of earnings and cash flow growth. Even when equities come under pressure during economic contractions, blue-chip companies are regarded as relatively safe and reliable investments, as they normally pay dividends, possess broad resources to invest in new technology and can benefit from economies of scale due to their size.
The DJI is a price-weighted index, so higher priced stocks have a more significant impact on the value of the DJI than those that are lower priced. The the 30 companies listed on the DJI may shift as share prices change. For example, when a company has a stock split, it impacts its weighting in the Dow, but not the total market value of the stock itself.
On the other hand, the S&P 500 is cap-weighted, which means those S&P companies with the largest market capitalizations have the highest weights in the index.
DIA's top ten holdings comprise approximately 57% of the fund. DJIA's top five companies include Apple (NASDAQ:AAPL), UnitedHealth (NYSE:UNH), Home Depot (NYSE:HD), Goldman Sachs (NYSE:GS) and Microsoft (NASDAQ:MSFT).
DIA's Current Standing
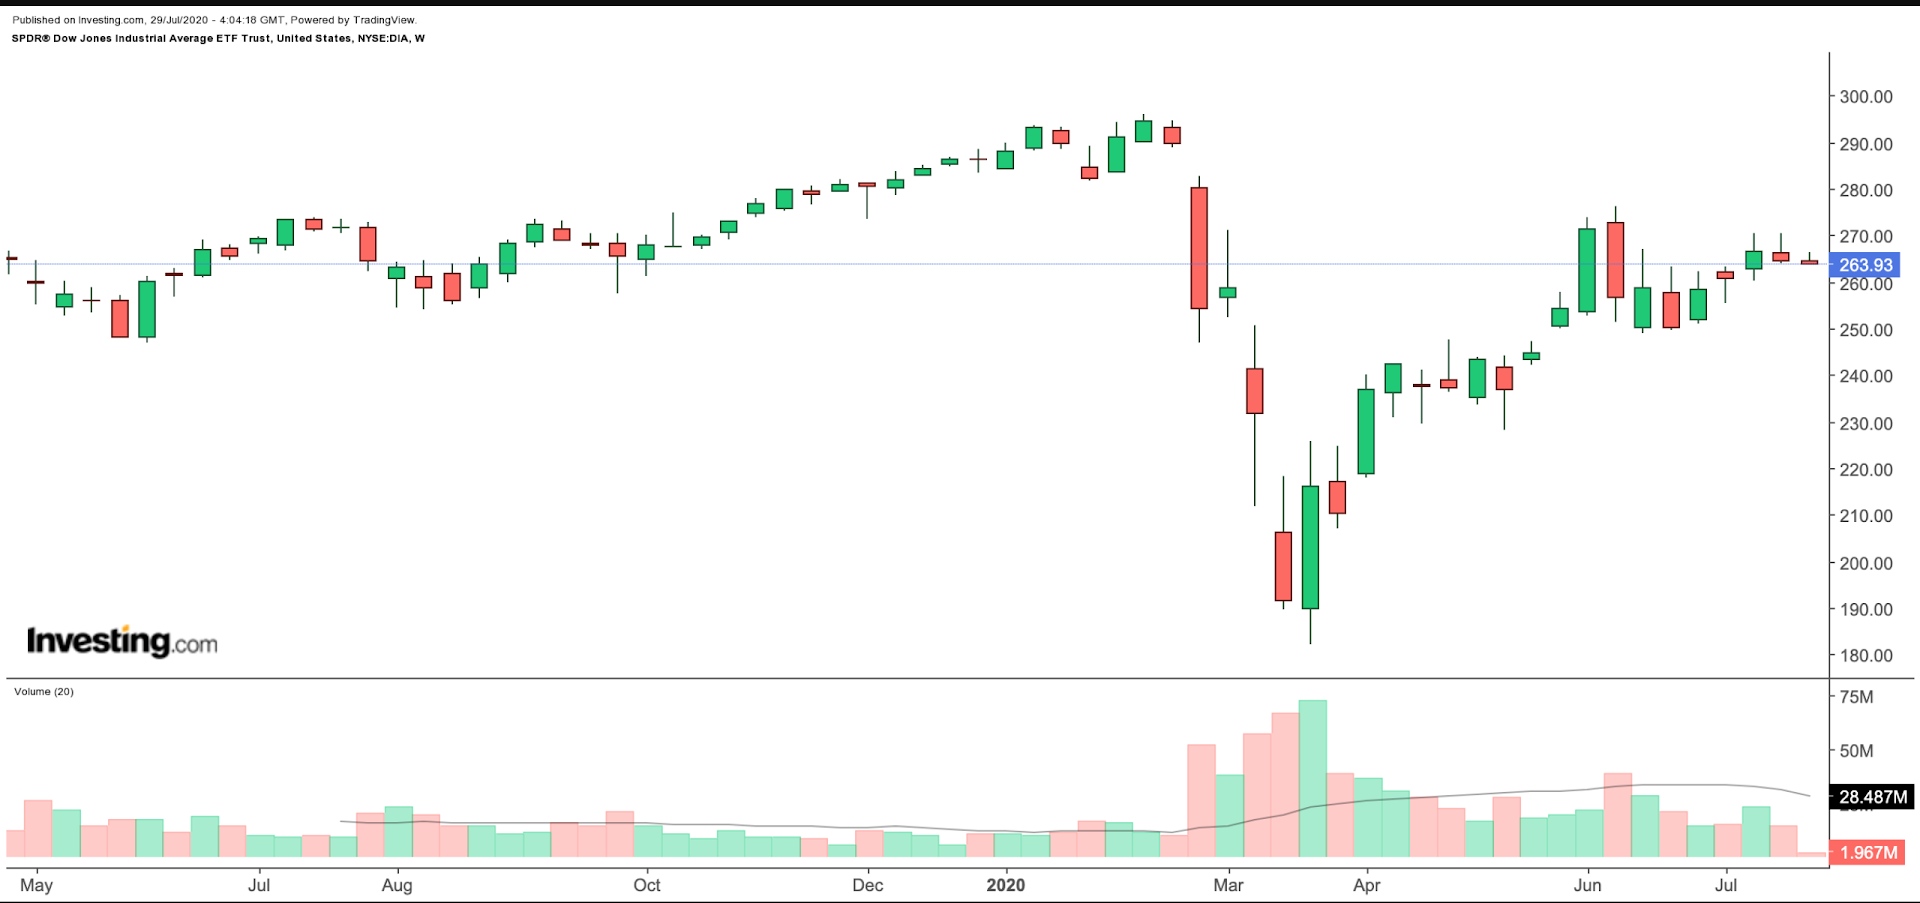
- Current Price: $263.93
- 52-week Range: $182.10-$295.87
- Dividend Yield: 2.25%
- Expense Ratio: 0.16% per year, or $16 on a $10,000 investment.
DIA started this year around $285, and on Feb. 12, hit an all-time high of $295.87. In the second half of February and March, investors began moving out of risk assets and stocks rapidly sold off. On March 23, DIA hit a 52-week low of $182.10.
Since then, the comeback for the ETF has been remarkable. On July 28, it closed at $263.93. That means a return of around 45% in about four months.

In fact, in the second quarter of 2020, the Dow Jones Industrial Average, and the DIA ETF which tracks it, produced its best quarterly return, over 17%, since the first quarter of 1997 when it had gained over 21%.
We are in the midst of a busy, and potentially mercurial earnings season. Since many stock prices have been making a run higher lately, the coming weeks will likely see short-term volatility and profit-taking across broader markets as well as the DIA, which could offer a better entry point for long-term investors.
Bottom Line
ETFs have exploded in popularity in recent years. The value proposition of the DIA ETF in particular is clear since it tracks some of the most widely held public companies in the US. This makes it a potential cornerstone portfolio holding for many long-term shareholders.
Other potential large-cap ETFs to invest in could be the Invesco Dow Jones Industrial Average Dividend ETF (NYSE:DJD) or Schwab U.S. Large-Cap ETF™ (NYSE:SCHX). We plan to cover these funds in the coming months.
