Market Overview
There are concerns in the US that “phase one” of a US/China trade agreement could be stalling. It is reported by sources close to the US negotiating team, that China have taken a very dim view of President Trump signing the Hong Kong bills into law. Traders made a move on Friday amidst low liquidity markets which has seen oil smash lower and pull gold higher.
The coming days are now likely to be all about restoring any lost momentum of the talks, but also over how the two sides move on tariffs. Will the proposed 15th December tariff increases no longer be implemented? Can China persuade the US to roll back on previous tariffs? It would appear that unless the answer is yes, achieving “phase one” will be a real struggle.
Market sentiment was hit on Friday, but over the weekend, some surprisingly positive China manufacturing PMI data has helped to boost risk appetite today. Both the official government data and the unofficial Caixin have the manufacturing sector in expansion in November. This covers a month during which confidence over “phase one” was growing. Subsequently, traders come into Monday looking at the glass half-full again. The key will be whether this data is reflected elsewhere, especially in the Eurozone and the US. Sterling remains mired in election uncertainty and continues to be the black sheep of the family.
Wall Street closed a shortened session weaker on Friday but coming back with a full complement today sees US futures ticking +0.2% higher. This more confident look to today’s trading has Asian markets positive, with the Nikkei +1.0% higher and Shanghai Composite +0.1%. European markets look a little muted but still positive today with the FTSE futures +0.1% and DAX Futures +0.1%.
In forex, there is a mixed to slightly risk positive look to markets. The China data seems to be benefitting NZD and AUD, whilst GBP is hit by election fluctuations.
In commodities, the positive risk is unwinding some of Friday’s moves with gold and silver weaker, whilst oil is over +1% higher initially.
The first trading day of the month is dominated by manufacturing PMIs for November across the major markets. It looks as though all are expected to remain in contraction. The Eurozone final Manufacturing PMI at 0900GMT is expected to be confirmed at 46.6 (46.6 Nov prelim, 45.9 Oct final).
The UK Manufacturing PMI at 09:30 GMT is expected to be 48.3 (after the flash reading of 48.3 last week) which would be weaker than the 49.6 from October. The US ISM Manufacturing is at 1500GMT and is expected to improve to 49.4 (from 48.3 in October).
Chart of the Day – USD/CAD
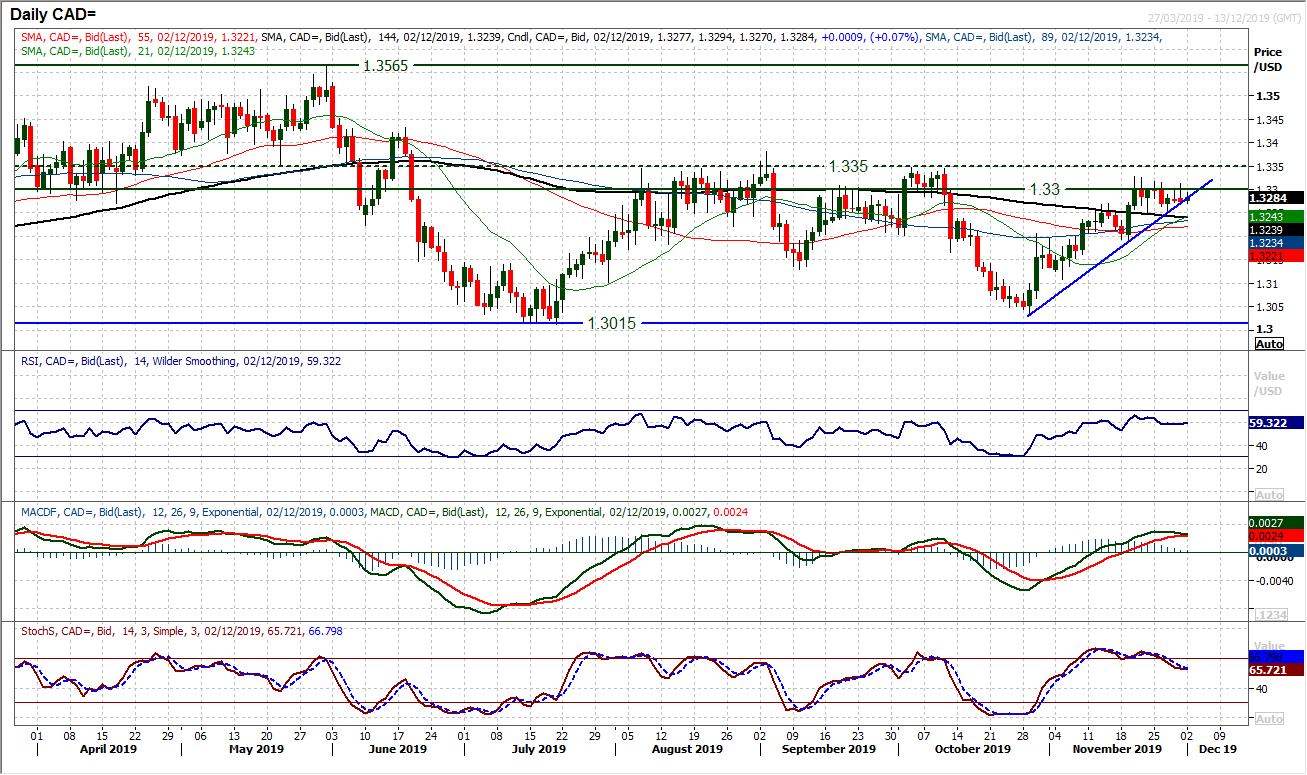
The recovery of the US dollar against the Canadian Loonie in recent weeks has formed an uptrend, but spending the past week losing momentum runs the risk of turning corrective again. Throughout much of the past 12 months, USD/CAD has pivoted around 1.3300/1.3350, with trading over the past 5 months using this as a band of resistance. Throughout the past two weeks intraday rallies above 1.3300 have failed. This consolidation is now testing the support of a five week uptrend. Already we see the Stochastics turning lower, whilst the rise through the MACD lines is also threatening to top out (similar to the August rally failure perhaps?). A close below the uptrend (today at 1.3280) would suggest the bulls are running out of steam, whilst the support at 1.3250 is key near term (a breach of support on the hourly chart would complete a near term top) with a breach opening the next support at 1.3185. It looks to be that rallies into 1.3300/1.3350 are a struggle now.
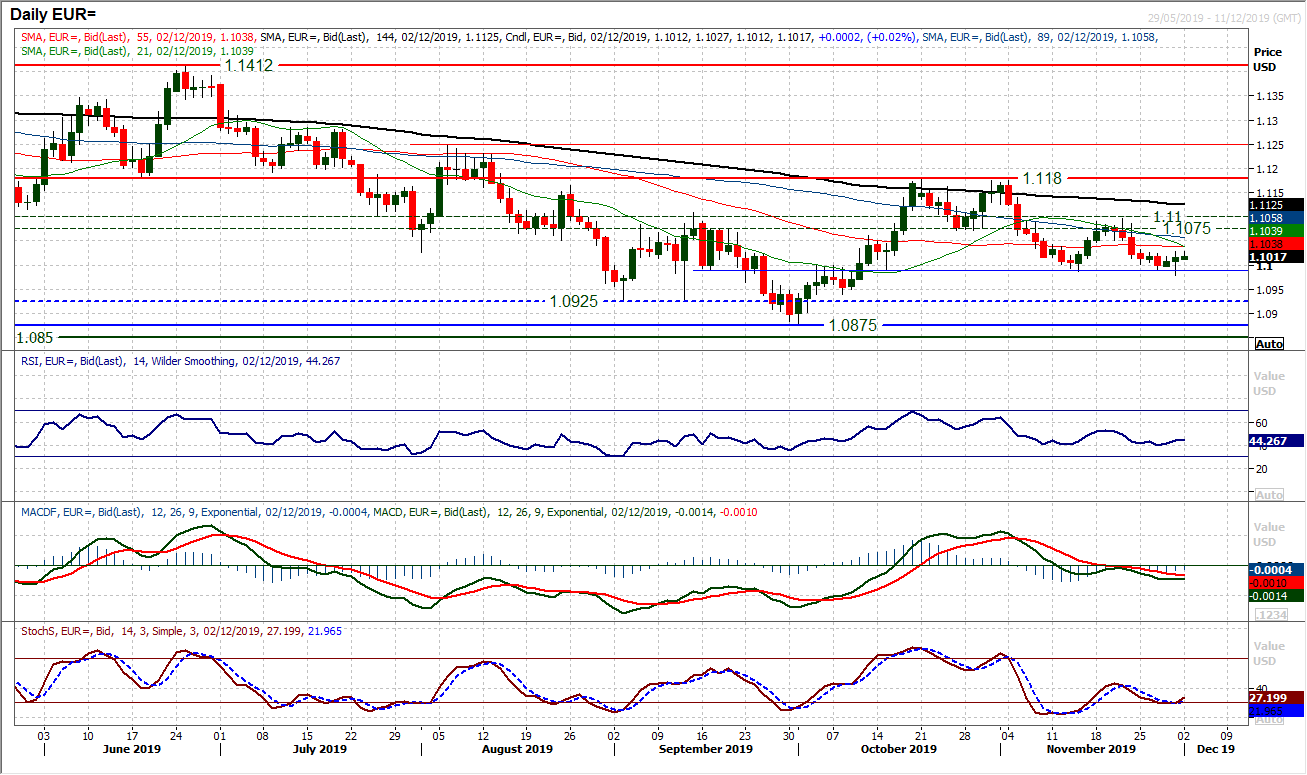
The euro bulls are hanging on to the support around $1.0990. This is a key moment for the near to medium term outlook. Having tested the support around $1.0990/$1.1000 throughout last week, a brief intraday breach on Friday would not be sustained and was almost instantly bought into. The positive candle that resulted now means two positive candles in a row and a slight more positive edge to momentum peeking through. The hourly chart reflects this and how the market reacts again today to the $1.0990/$1.1000 area will be interesting. The bear failure on Friday has the capacity to shift the emphasis on this chart now. We continue to see initial resistance at $1.1030 and if the euro can pull above here then a swing back higher into the $1.1075/$1.1100 mid-range pivot band could be seen. A close back under $1.0990 would open $1.0875/$1.0925.
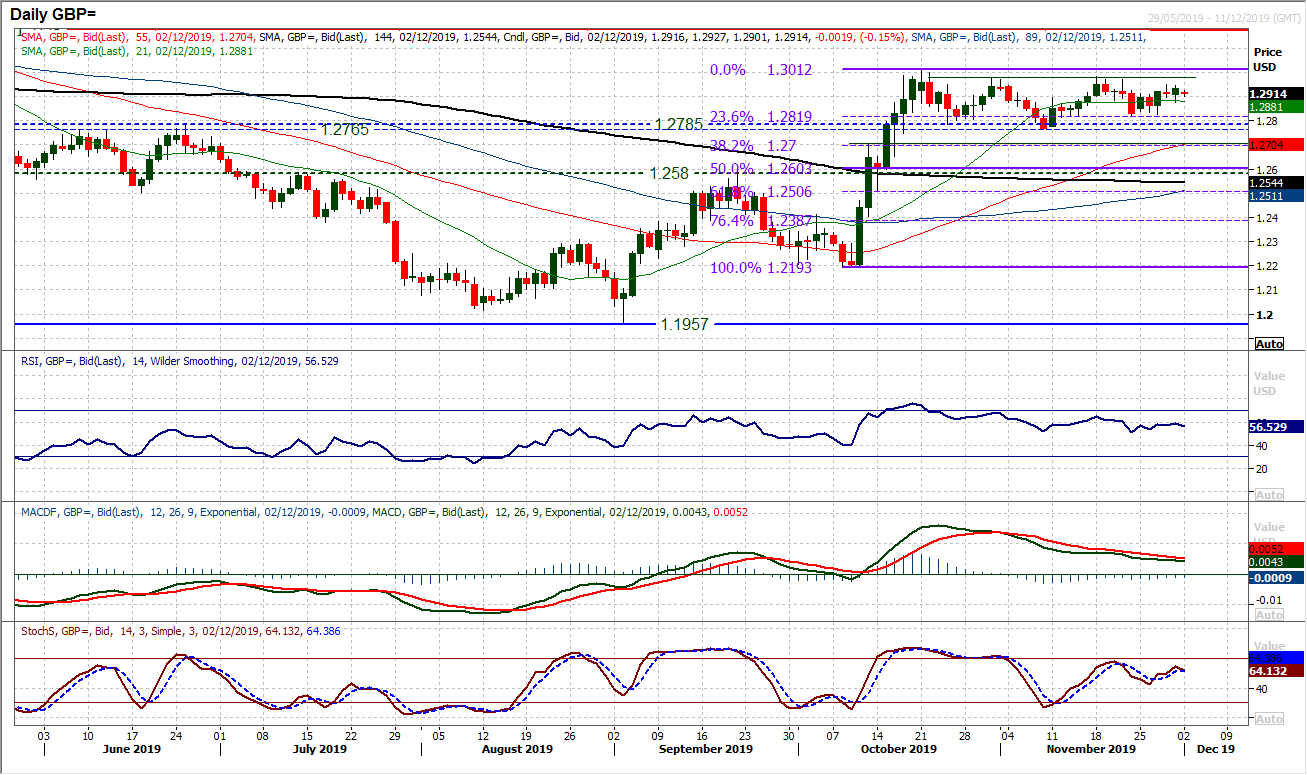
There is still very much of a mixed feel to the outlook on Cable. For weeks now as the UK election campaign has been running, there have been swings higher and lower depending upon polling data and assessment of the various parties’ performances in certain debates. Essentially a trading range of around 250 pips between $1.2765/$1.3010 is in place. Momentum indicators have moderated back to a more neutral positioning, but still retain a positive bias. It points to the fact that forex markets anticipate a Conservative victory of some description. We continue to look to play this range of 250 pips until the election on 12th December. There is minor resistance at $1.2950 whilst building up further at $1.2975 where the range highs kick in. The support is initially with Friday’s low at $1.2875 whilst $1.2820 is far more considerable being multiple recent lows but also the 23.6% Fib retracement of the October rally. Hourly momentum is very much ranging too.
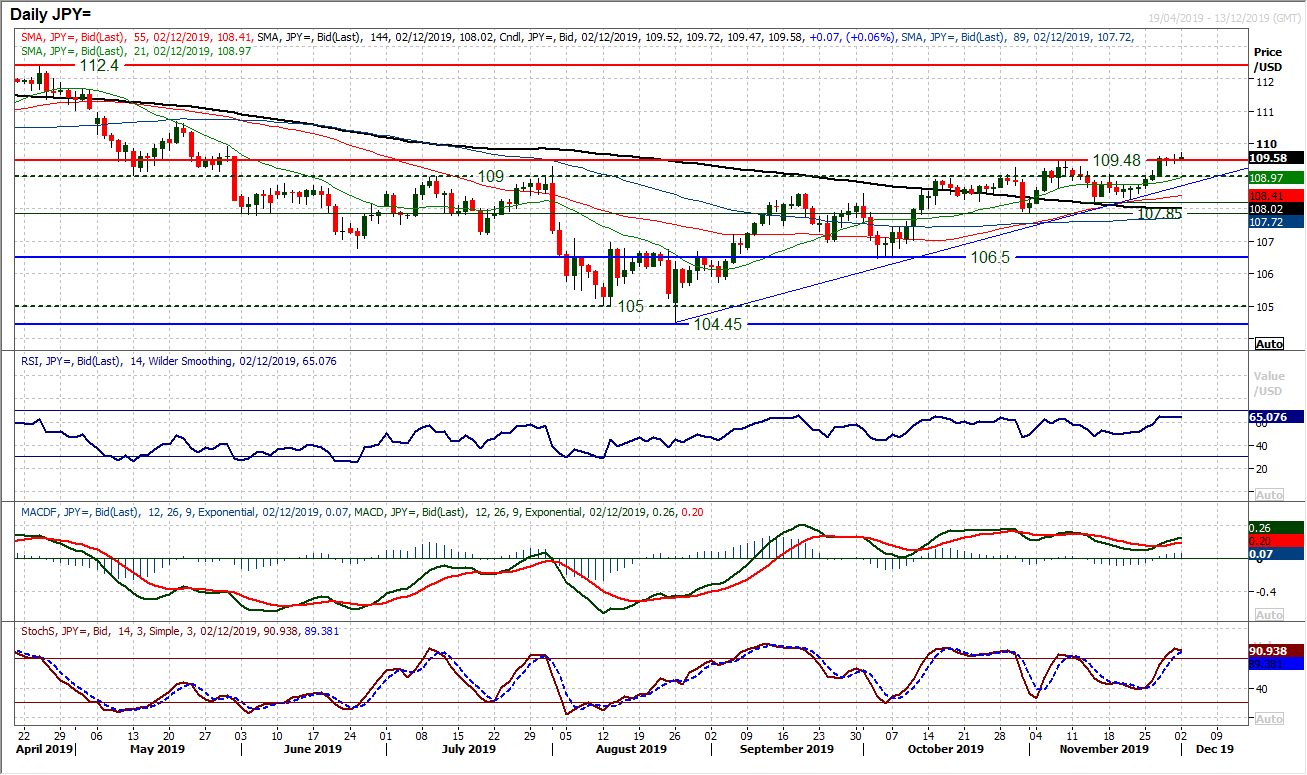
Given the lack of direction throughout sessions on Thursday and Friday (due to Thanksgiving), it means that how traders react today could be key for the near term outlook. We have been looking at the breakout above 109.50 as a potential game changer for a market that has failed repeatedly between 109.00/109.50 for the past six months. If Dollar/Yen can now begin to build support in the 109.00/109.50 band, then the bulls will take higher conviction from the move. It does seem as though momentum is really positioning for breakout this time, with the RSI into the mid-60s and currently at 10 week highs, whilst Stochastics move into bullish configuration and MACD lines rising. Given the market already having closed above 109.50, another close above this resistance would open the upside. The early tick higher today looks encouraging. Next resistance is minor at 109.90 but the May high at 110.65 is next key. A 14 week uptrend is supportive at 108.70, whilst 108.25 is the first key higher low support.
Gold
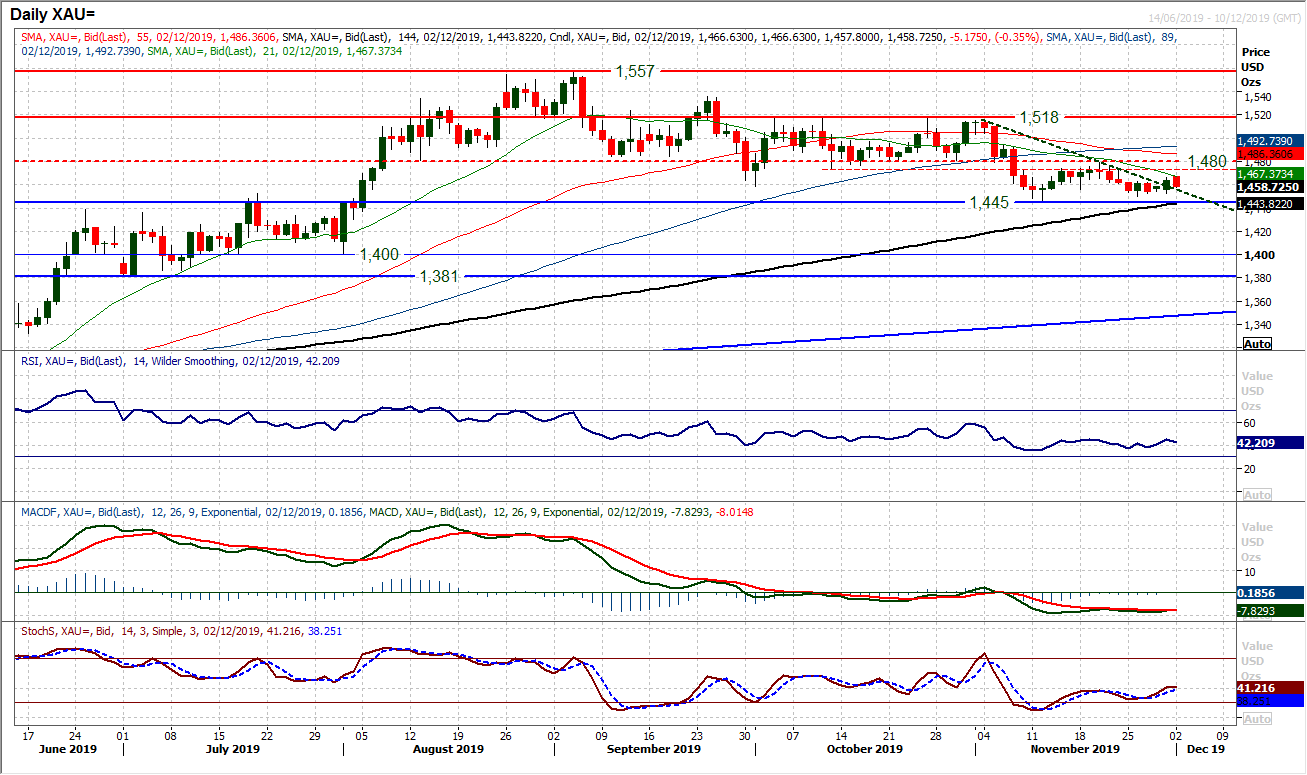
There has been a consolidation over recent sessions with US traders focusing more on their turkey and/or buying faux discounted items for Black Friday. However, this consolidation has moved into the final month of the year with a breach of a four week downtrend. A swing higher on Friday formed a bull candle and questions who is in control of the market now. However, essentially, this trend breach does not really change the narrative for gold, which continues to be medium term corrective. Subsequently with the resistance building at $1480 which is an area of overhead supply of the August to October old stale bulls, we see rallies fading for pressure back on the $1445 low again. It is interesting to see gold already slipping back again today. The bulls do not look to be on especially solid ground. Momentum indicators remain medium term correctively configured and anything on RSI around 45/50 should be seen as an opportunity if the market begins to edge higher in the coming days. We remain sellers into strength, it just depends on how strong the support at $1445 ends up being.
WTI Oil
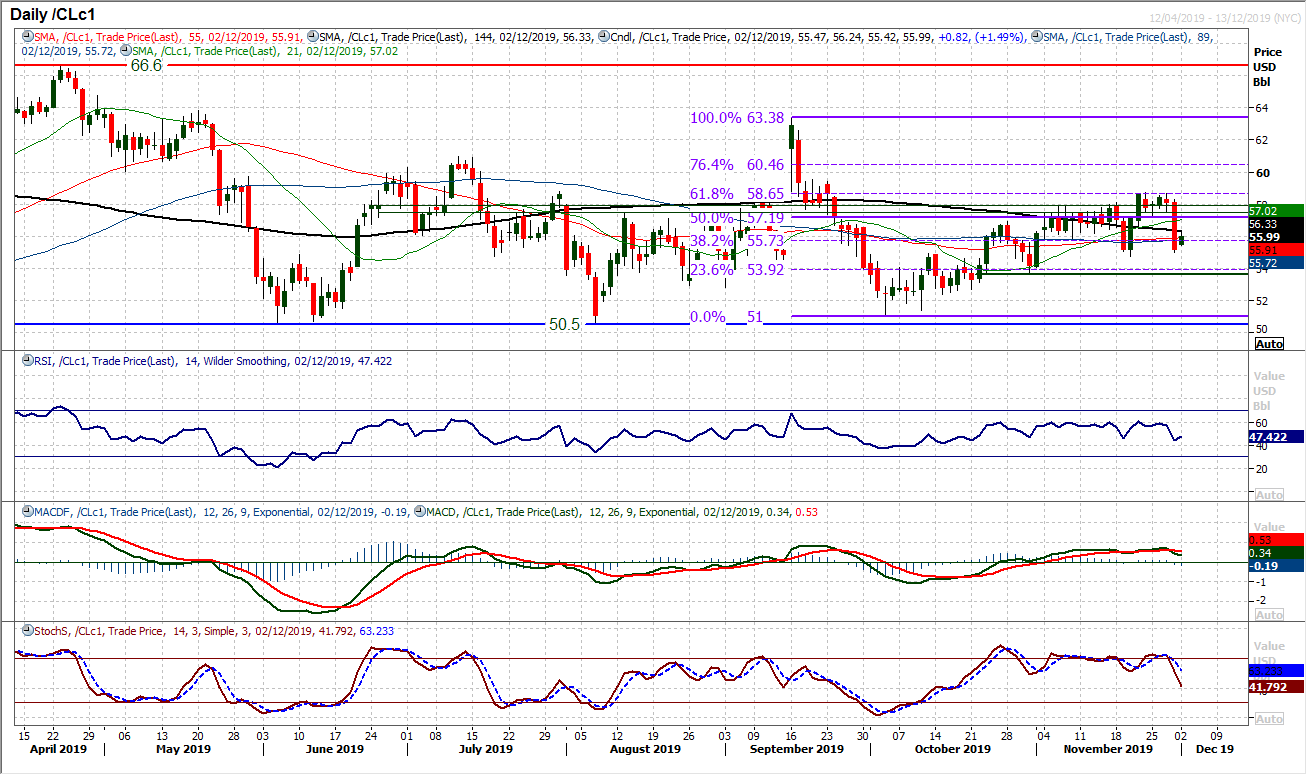
Our confidence in the positive outlook on WTI has been shaken once more, but is not yet broken. With Friday’s sharp negative session which saw the price fall by 4%, we have again seen a promising position scuppered. The key once more will be the bull reaction today, as previously there has been an almost instant positive reaction. For now we see the run of higher lows still intact, but this means that support at $54.75 is key. The momentum indicators are deteriorating now, but essentially this is still within a positive configuration. Depending upon news flow regarding the US/China dispute, we see that this may now turn into a choppy ranging outlook. The 50% Fibonacci retracement has often been a pivot in recent weeks (at $57.20) and could again act as a magnet. The longer the market trades below this the more of a negative bias that WTI takes on.
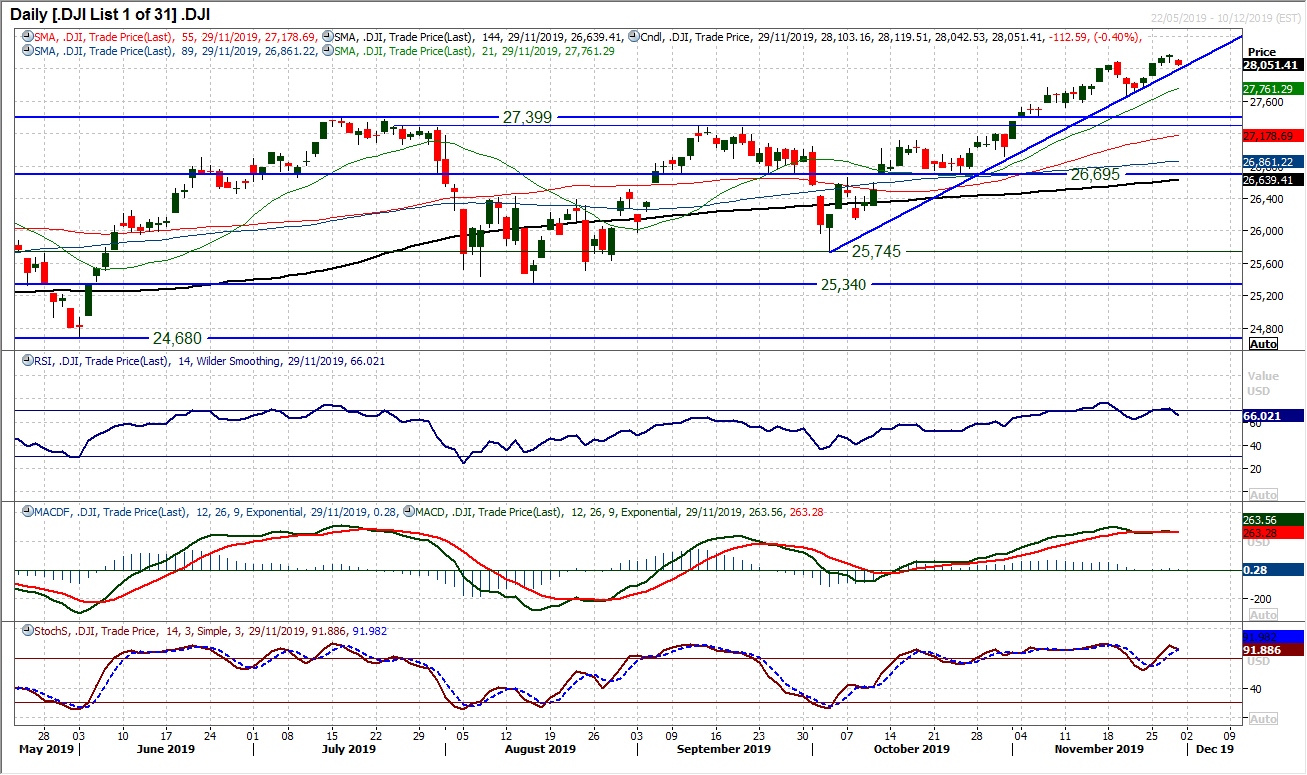
The immediate outlook for Wall Street is still set close to the progress of the US/China trade talks. Friday’s reaction lower on a slightly shorten session has again questioned the bull control, but with futures ticking back higher again today, this move looks to be ready to re-establish the bull control. On a technical basis, the uptrend of the past eight weeks is still supportive and comes in at 28,050 today. It looks to be that Friday’s move has helped to unwind the market and renew upside potential. Although daily indicators have rolled over, this is still well contained within a positive medium term outlook. It looks as though Friday’s low at 28,042 will take on a supportive role initially today as the bulls eye up Thursday’s all-time high of 28,175 again.
"""DISCLAIMER: This report does not constitute personal investment advice, nor does it take into account the individual financial circumstances or objectives of the clients who receive it. All information and research produced by Hantec Markets is intended to be general in nature; it does not constitute a recommendation or offer for the purchase or sale of any financial instrument, nor should it be construed as such.
All of the views or suggestions within this report are those solely and exclusively of the author, and accurately reflect his personal views about any and all of the subject instruments and are presented to the best of the author’s knowledge. Any person relying on this report to undertake trading does so entirely at his/her own risk and Hantec Markets does not accept any liability. """
