Market Overview
Reaction to the renewed concerns of the scope of the Coronavirus (or COVID-19 which is the World Health Organisation’s new official name) drove a knee-jerk reaction back into safety on financial markets yesterday. However, the move seems to have been short-lived. Initial moves were broadly retraced into the close and there is a sense that the dust is quickly settling this morning. Bond yields have rebounded, the Chinese yuan recovered, whilst there was a notable degree of support for oil. There is still much uncertainty on a day to day basis, but the bulls will be encouraged by the reaction into yesterday’s close. Away from the broader sentiment moves of the Coronavirus, there is a significant sell-off on the euro taking hold. Priced against the US dollar, the euro plunged to multi-year lows yesterday and remains deeply oversold.Fears of sluggish growth for the Eurozone will come under the spotlight today with the Q4 GDP data. With the ECB monetary policy fuel running on fumes, the economic recovery that was meant to be coming in the Eurozone this year is some way off. If the euro is anything to go by, then traders are voting with their feet. However, the momentum of the sell-off is significantly over-stretched now and the potential for a sharp technical rally rises by the day. The strong daily moves on EUR may not be about to stop any time soon.Wall Street recovered some intraday losses to close mildly lower (S&P 500 -0.2% at 3374). With US futures slightly higher early today (+0.2%) this has resulted in a mixed Asian session (Nikkei -0.6%, Shanghai Composite +0.4%) and European markets to look towards positive opens today (FTSE futures and DAX futures both +0.2%). In forex, there is little real move, but it is interesting that the commodity currencies are edging higher again, with AUD and CAD performing well. In commodities, the rally on gold has just begun to dissipate again, whilst oil is marginally positive in early moves.The second reading of Eurozone growth is in focus during the European morning. Eurozone Flash GDP for Q4 is at 1000GMT and is expected to be confirmed at +0.1% (+0.1% at prelim first reading). The main data for the day is US Retail Sales at 1330GMT which is expected to see core ex-autos monthly sales increase by +0.3% in January (having grown by +0.7% in December). The US Industrial Production for January is at 14:15 GMT and is expected to decline by -0.2% (having fallen by -0.3% in December). Finally, keep an eye out for prelim Michigan Sentiment for February at 15:00 GMT. The headline is expected to slip slightly to 99.5 (from 99.8 in January), driven by a slight decline in the Michigan Expectations component to 90.3 (from 90.5) whilst Michigan Current Conditions are expected to improve slightly to 115.0 (from 114.4 in January).
Chart of the Day – EUR/GBP
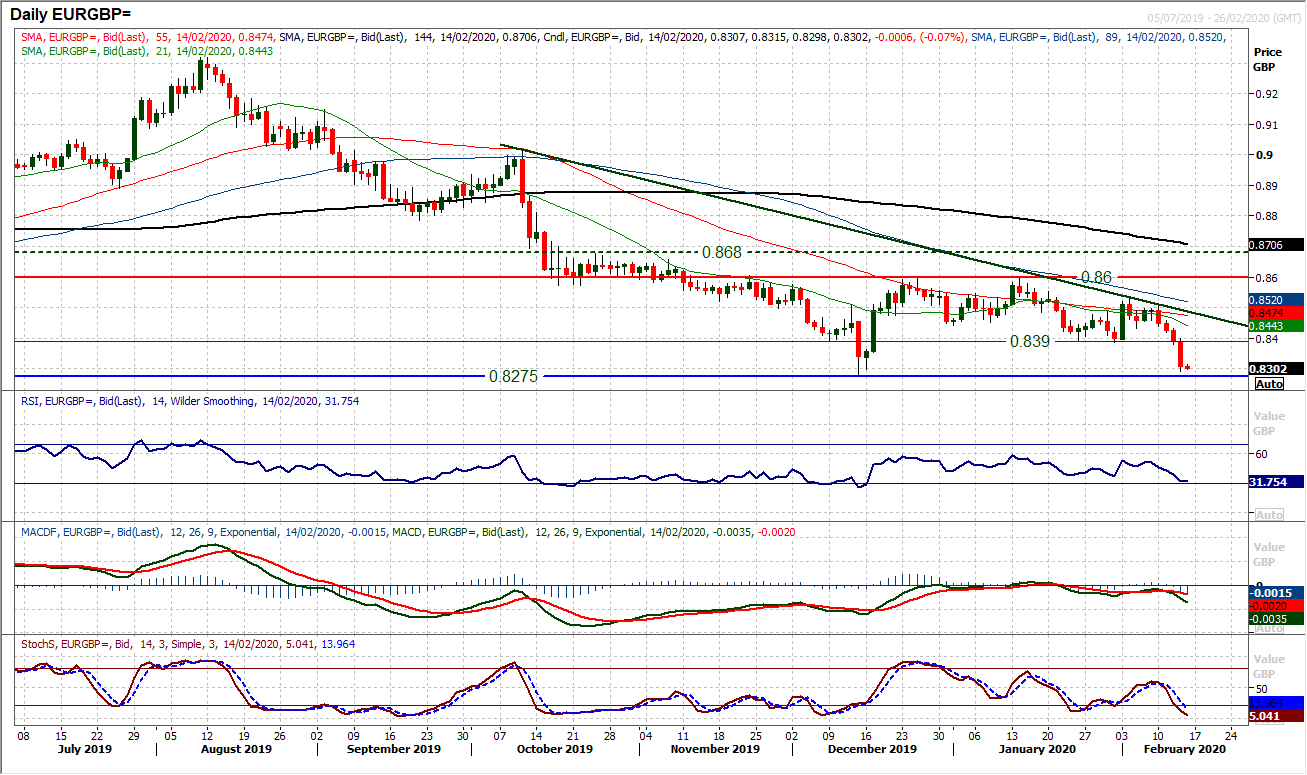
We could have picked any one of the euro crosses to show the current plight of the stricken euro. EUR/GBP suffered significant selling pressure yesterday with a massive negative candlestick accelerating the market to close at its lowest level since the immediate Brexit vote aftermath in late June 2016. The market saw an intraday low and subsequently bounced off £0.8275 in December but the negative pressure currently building across the Euro, suggests that this is a support likely to at least be tested now. Momentum is very bearishly configured but also retains downside potential. With RSI still above 30 (consistently at or below 30 throughout much of October and December), MACD lines only just having bear-crossed lower below neutral, the Stochastics are also falling bearishly below 20 now. The market has been in a multi-month downtrend for several months now (coming in around £0.8485 today) but having broken decisively below £0.8390 support yesterday, this now becomes overhead supply for a technical rally. Bearish configuration is confirmed across the hourly chart indicators and any intraday rebound that pulls the hourly RSI towards 50 looks like an opportunity to sell. Below £0.8275 is pretty open towards £0.8100/£0.8115.
EUR/USD
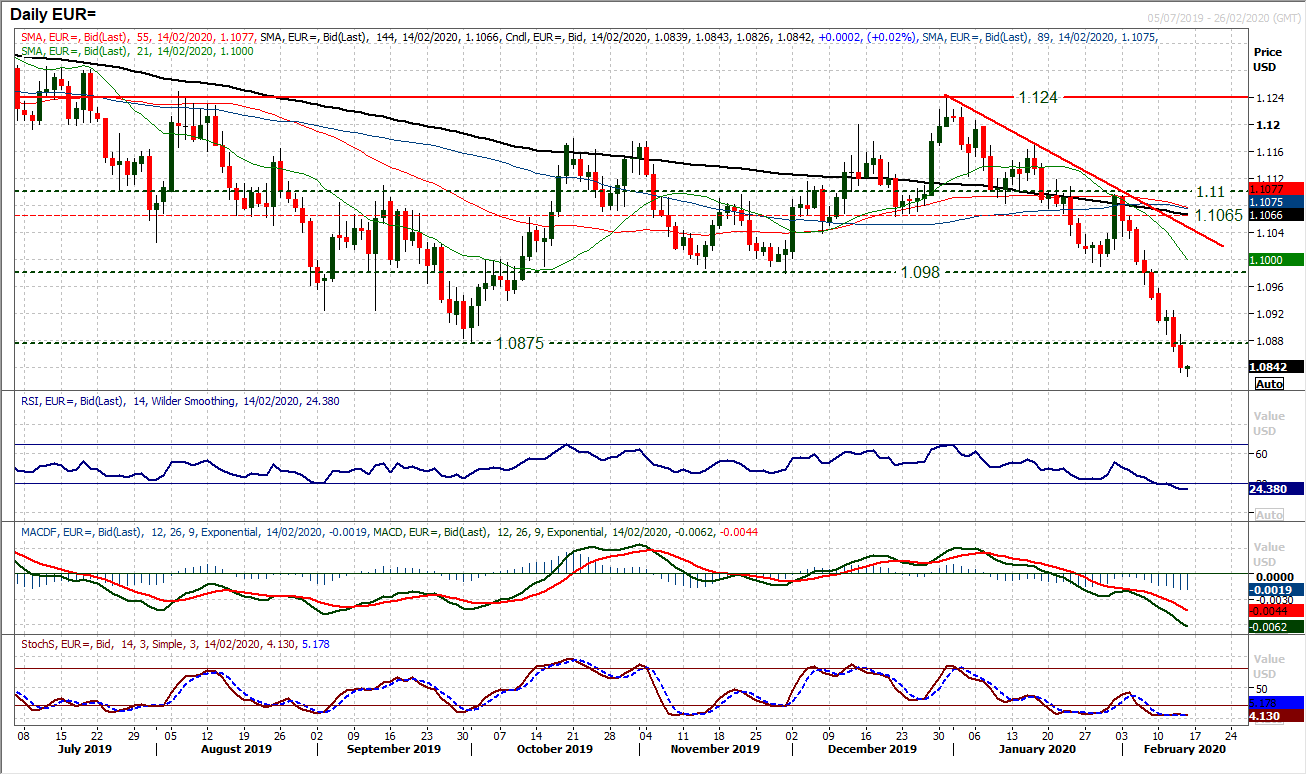
The big concern for anyone long of the euro right now is that the breakdown below $1.0875 has barely even looked back. The market is deeply oversold on a historic basis and the suggestion is that a technical rally is subsequently due. However, there is little appetite to support the market right now and it is just not stopping. EUR/USD is now the lowest it has been since April 2017 and the next real support is not until $1.0500/$1.0570. This all makes trading EUR/USD a game with heightened risk right now. The market is intent on falling, but with the elastic of the RSI so overstretched, if a technical rally sets in, it could be a substantial rebound. For a number of days now, we have been on the lookout for potential signals of recovery. The hourly chart RSI moving decisively above 50 would be a signal for confirmation, but is still some way off this morning. No lower high of any substantial degree has been breached throughout the near two week sell-off. So we are also watching initial resistance $1.0865/$1.0890. We are very cautious of being caught too short on the euro right now.
GBP/USD
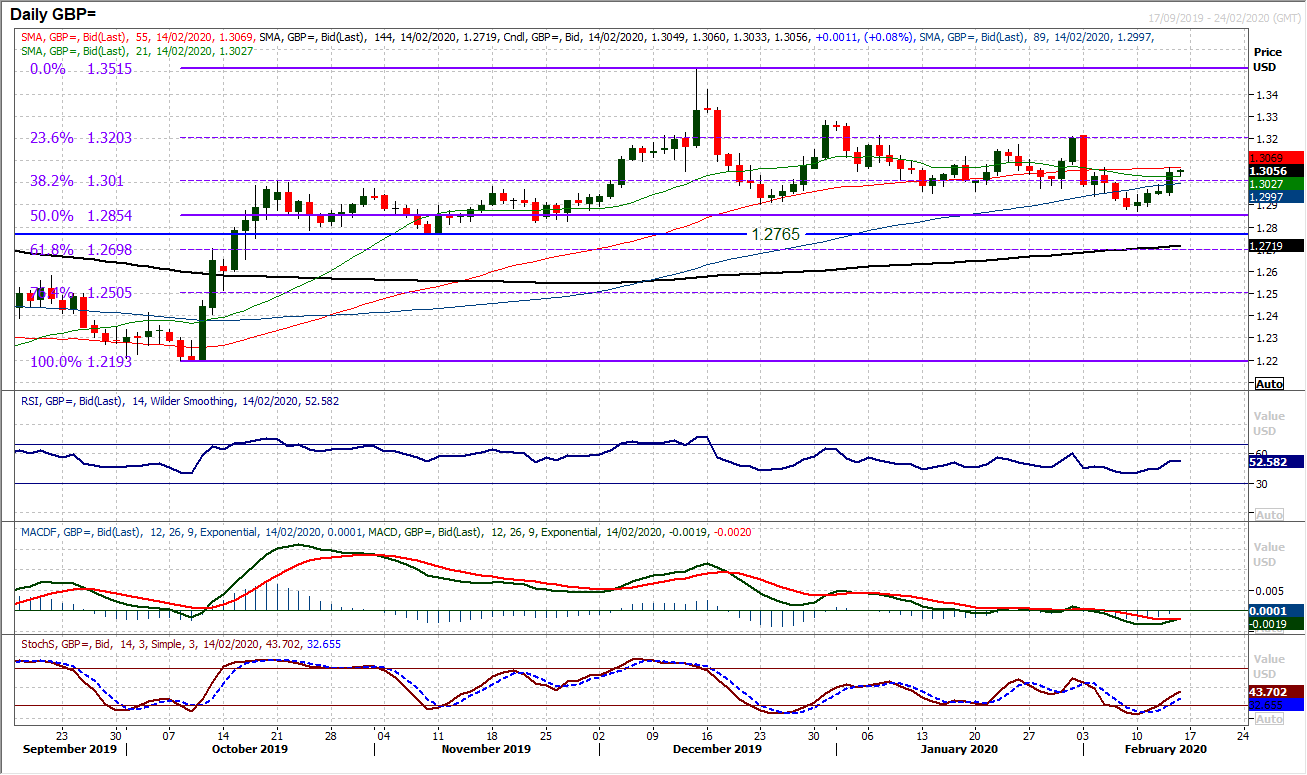
The case for another rebound within the medium term range has been building for a number of days now. Yesterday saw the decisive move higher, back through all the resistance between $1.2940/$1.3000 and into a more neutral position once more within the range. Momentum indicators have swung back into more of a construction configuration for sterling and the next resistance at $1.3070 is being tested. If the Cable bulls can break through this initial barrier today then the outlook improves for a move back towards the old 23.6% Fibonacci retracement around $1.3200 again and the February high at $1.3215. The move has helped to re-assert our view that sterling does not want to go lower for very long. It may have been a political event to help the move yesterday (a change of UK Chancellor opens for potential fiscal loosening, which is seen as sterling positive), but the medium term outlook remains underpinned to buy Cable into weakness. Support at $1.2870 has firmed.
USD/JPY
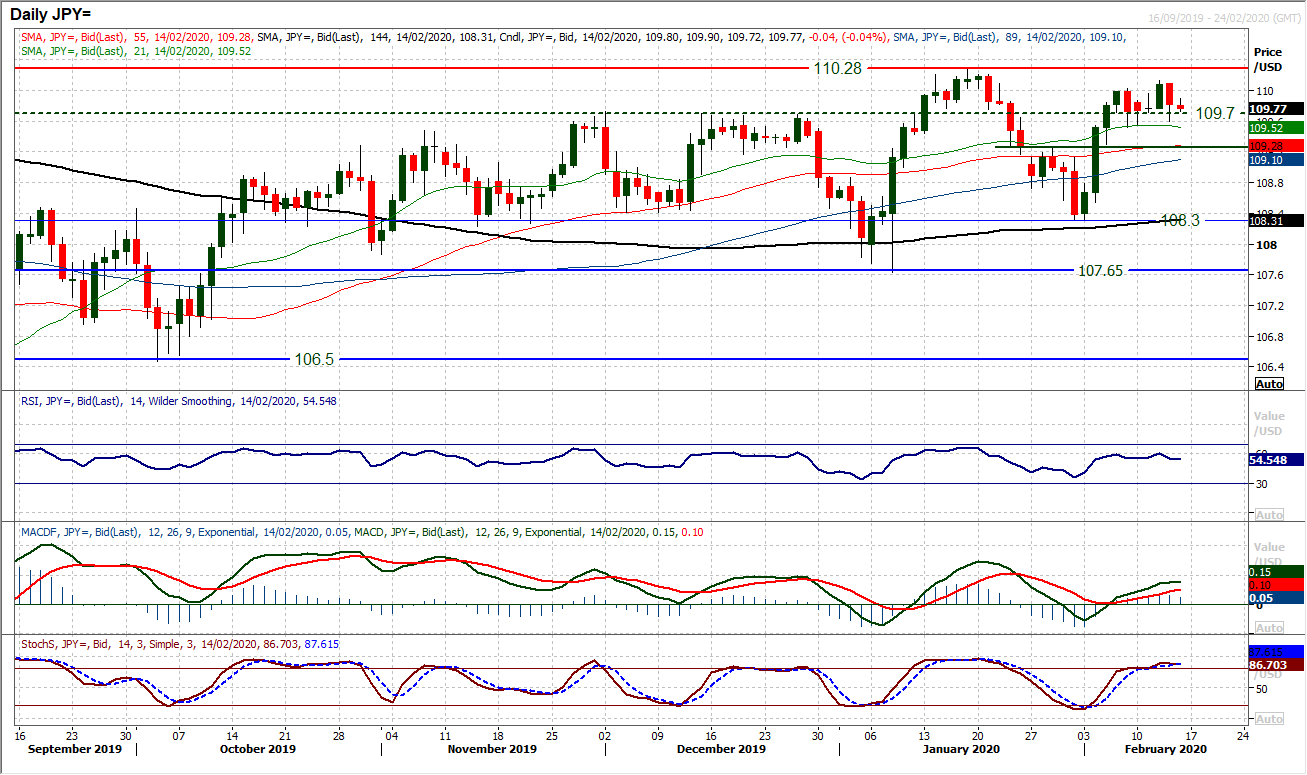
Yesterday’s negative candle dragged the bulls back again and suggests that the market is gravitating around the 109.70 breakout once more. This moves of the past week and a half suggest that Dollar/Yen is in fairly tight consolidation. The market is being supported on intraday weakness into the band 109.50/109.70, whilst unable to push through resistance 110.00/110.15. We continue to see Dollar/Yen with a mild positive bias and see near term weakness as a chance to buy. As the market has traded with a mix of candlesticks in recent sessions, momentum indicators are slightly positively configured (RSI consistently above 50, MACD lines advancing above neutral and Stochastics above 80). This positive bias will remain whilst the market trades above the pivot around 109.25. We continue to favour a move to test 110.30 in due course.
Gold
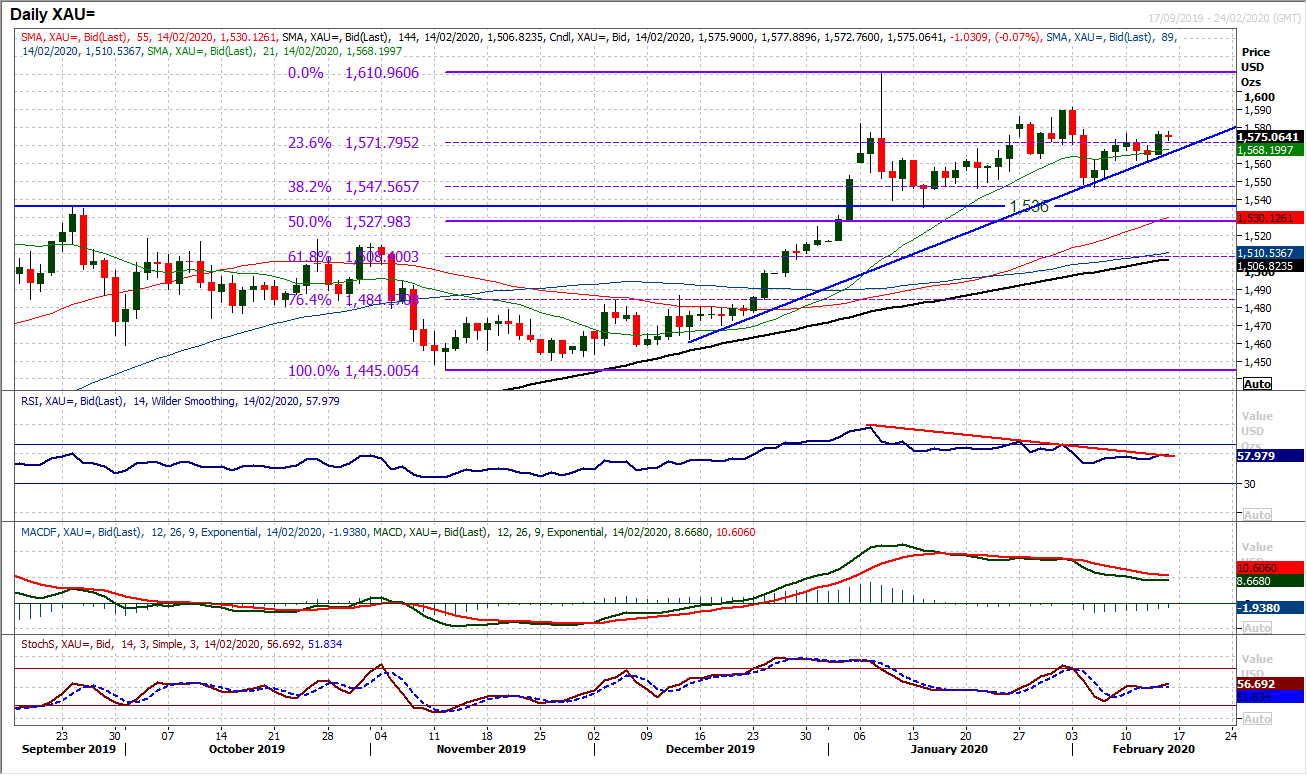
There is a slight positive bias that has returned to the gold market in the past 24/36 hours. This comes as broad market sentiment has taken fright once more from the Coronavirus and an associated move back into safe have assets has been seen. The question is now whether gold can begin to find traction and break the shackles of the consolidation of recent weeks. Trading clear of the 23.6% Fibonacci retracement (of $1445/$1611) at $1572 and near term resistance at $1577 would open a test of $1591. Whilst the market is testing this barrier again this morning, right now it is unable to make the breakout. The hourly chart shows the growing importance of $1562 as near term support now, however, there is more that is needed from the bulls to really break free. The hourly RSI may be between 50/70 consistently is the past day or so, but needs to push above 70 to really suggest the bulls are finding traction. Hourly MACD and Stochastics rolling over in the past 12 hours or so does not suggest the bulls are ready yet. Watch initial support at $1571 as a basis for a new near term higher low formation now. If this is decisively breached this morning, it would suggest the bulls are pulling back again.
WTI Oil
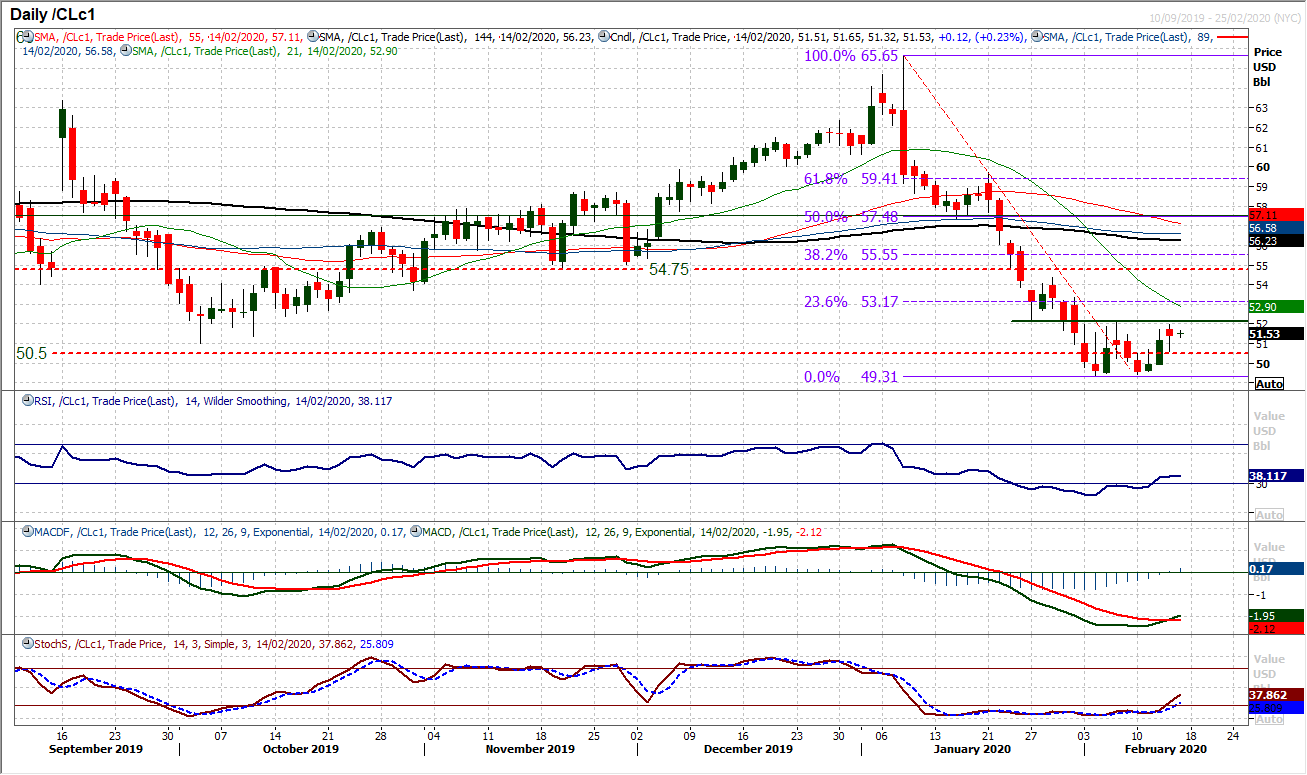
There is an increasing sense that a recovery is building on WTI. A strong positive candle on Wednesday had its credentials tested early yesterday, but a decent recovery into the close has helped to drive what is an increasingly encouraging set of momentum indicators. The bull crosses coming through on MACD lines and also Stochastics, whilst RSI is rising at its highest level in three weeks. The resistance around $52.20 is key for recovery now, being a pivot and also neckline for a potential base pattern. A close above would imply around $2.70 of additional recovery which would be a move back to the old key floor $54.75/$55.00. We talked about the $50.50/$51.00 band becoming support and yesterday’s higher low at $50.60 is increasingly important. The market is fairly settled this morning, but the signs of recovery are growing.
Dow Jones Industrial Average
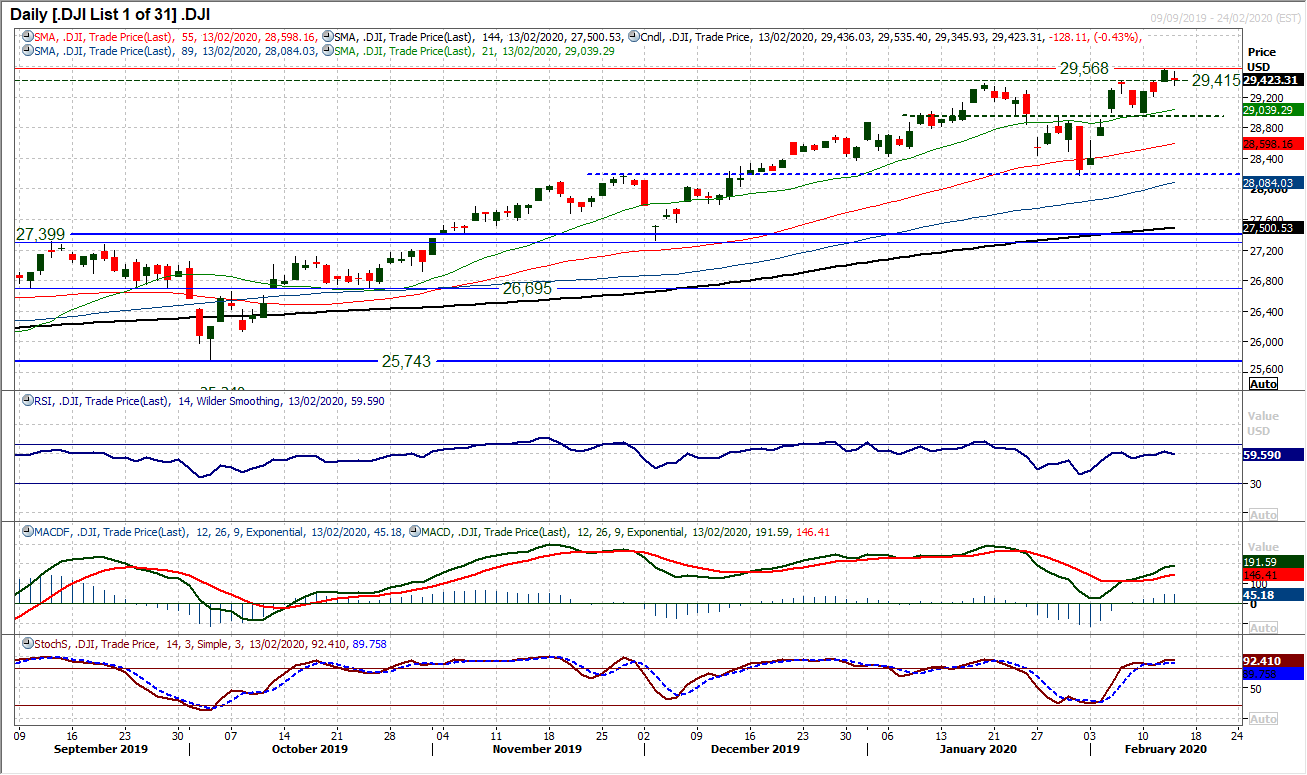
The Dow does not have the feel of a market that wants to go down for too long at the moment. A close lower of just under half a percent has seen a pullback from the all time high of 29,568 however the bullish technical aspects of the chart remain firm. The daily candlestick was a very small bodied negative candle, but with momentum indicators still positively configured, weakness is just a chance to buy still. With the RSI above 60, MACD are rising and Stochastics lines are The unwind is back to the first breakout support area between the old highs 29,374/29,415. All moving averages are rising in bullish sequence and again suggest buying into weakness. The bulls will remain in control at the least whilst the pivot support band 28,950/29,000 holds. There is still little technical reason not to expect the all-time high of 29,568 to be retested and breached, to then open the way towards 30,000.
"""DISCLAIMER: This report does not constitute personal investment advice, nor does it take into account the individual financial circumstances or objectives of the clients who receive it. All information and research produced by Hantec Markets is intended to be general in nature; it does not constitute a recommendation or offer for the purchase or sale of any financial instrument, nor should it be construed as such.
All of the views or suggestions within this report are those solely and exclusively of the author, and accurately reflect his personal views about any and all of the subject instruments and are presented to the best of the author’s knowledge. Any person relying on this report to undertake trading does so entirely at his/her own risk and Hantec Markets does not accept any liability. """
