- Investors look to be taking some profits during the U.S. session, while regional Asia benchmarks gained
- Yields and gold however, suggest safe havens remain in play
- Technicals suggest the SPX is about to face another selloff
- OPEC's two-day meeting begins today in Vienna. Production cuts will likely be a key subject on the agenda.
- Australia releases retail sales data late this evening U.S. time.
- On Friday, nonfarm payrolls data for February will be announced in the U.S.
- Canada releases employment change numbers on Friday as well.
- The Stoxx Europe 600 Index decreased 1.25%
- Germany’s DAX sank 1.18%.
- Futures on the S&P 500 Index slumped 1.9%.
- The MSCI Asia Pacific increased 1.2%.
- The Dollar Index was little changed.
- The euro rose 0.22% to 1.159.
- The British pound gained 0.33% to $1.29.
- The Japanese yen strengthened 0.2% to 107.28 per dollar.
- The South Korean won strengthened 0.5% to 1,181.30 per dollar.
- The yield on 10-year Treasuries declined four basis points to 1.02%.
- The yield on 2-year Treasuries fell four basis points to 0.65%.
- Germany’s 10-year yield rose two basis points to -0.62%.
- Japan’s 10-year yield climbed one basis point to -0.112%.
- Australia’s 10-year yield climbed six basis points to 0.784%.
- West Texas Intermediate crude increased 0.4% to $46.98 a barrel.
- Iron ore gained 1.4% to $89.44 per metric ton.
- Gold strengthened 0.1% to $1,638.60 an ounce.
Key Events
After Wednesday's U.S. market surge, this morning, futures for the S&P 500, Dow Jones and NASDAQ are back in negative territory, along with European shares, as global virus warnings increased. However, Asian benchmarks earlier extended their gains, riding the coattails of Wall Street's rally which saw all major U.S. indices jump about 4%, after enduring, over the past week, one of the worst equity selloffs in years.
Yield declines eased, oil climbed and gold gained.
Global Financial Affairs
S&P 500 futures retreated from the top of a rising flag, bearish after the 16% plunge within just seven sessions from the Feb. 20 peak of 3397.50, to the Feb. 28 bottom of 2853.25.
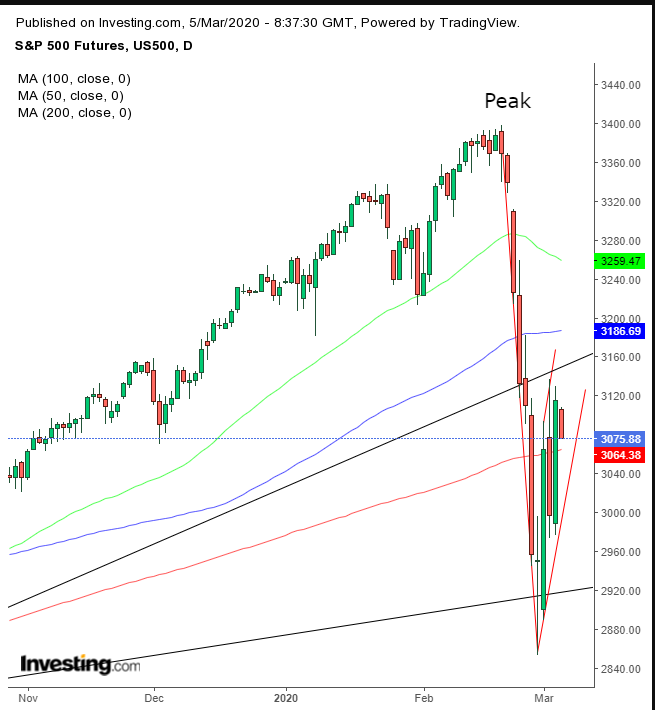
The formation of the flag right on the 200 DMA, and between the support of the uptrend line since June 3 and the resistance of the broken uptrend line from Dec. 25, 2018, emphasizes how crucial this technical level is.
17 of the 19 industry sectors of the Stoxx Europe 600 Index initially boosted the pan-European index to a higher open. However, the reality of the spread of Covid-19 outside of China weighed on regional indices.
Early Thursday, all major Asian benchmarks rose at least 1%, extending that regional rebound for a fourth day. Hong Kong's Hang Seng outperformed (+2.08%), followed closely by China’s Shanghai Composite, (+1.99%), erasing the declines spurred by virus fears.
The mainland China index also hit a two-year high, a sign of market resilience. As well, investors shifted to sectors that would gain from fiscal stimulus, such as infrastructure.
Yesterday, U.S. stocks jumped for the second time in three days after Congress approved an $8 billion bill to fight the coronavirus. The event compounded the earlier boost to markets from Joe Biden's unexpected, Super Tuesday primary victory versus Bernie Sanders, whose version of socialism has been spooking investors.
On Wednesday, the S&P 500 gained 4.22%.
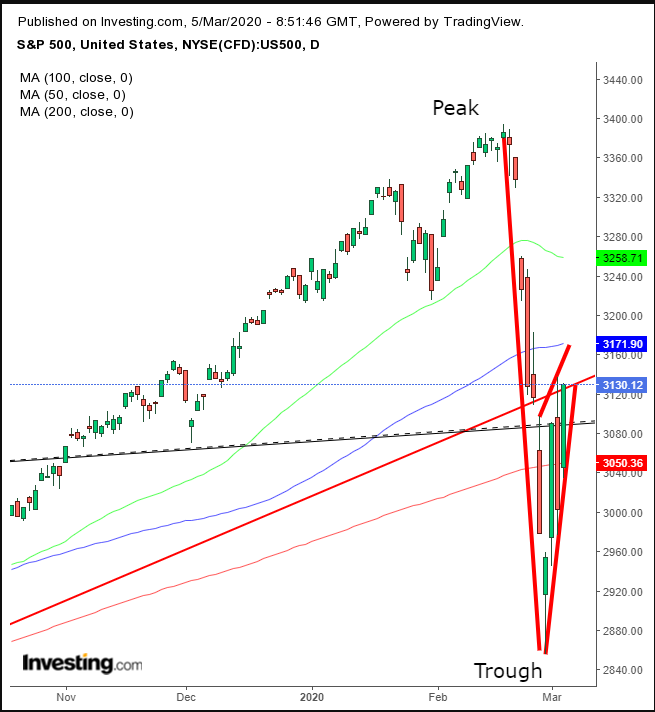
From a technical perspective, the recent up and down could be painting a less optimistic picture. It may simply be the give-and-take between bears who enjoyed the selloff and washed out bulls along with fresher, more hopeful bears looking for the repeated selloff the pattern promises.
Note that the price stopped dead below the previous day’s high and the broken uptrend line since January 2019. A downside breakout would increase the risk for a second, lower trough, establishing a downtrend, whose decline is likely to trigger a bear market when completing a 20% drop from February 2019’s highest close. This would require a close only 4% below the Feb. 28 close in order to officially call it a bear market.
The Treasury yield curve steepened on Wednesday—a sign investors see more U.S. stimulus coming.
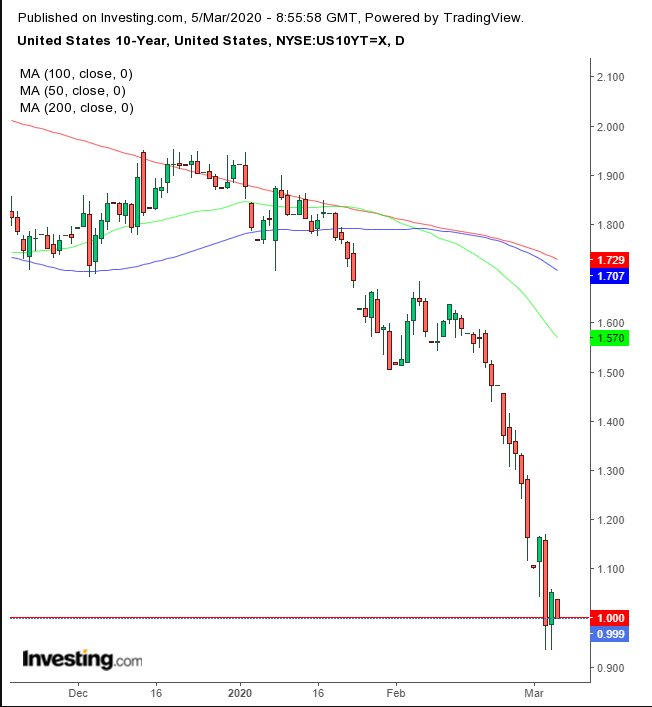
The U.S. 10-year yield moved back above 1.00, before falling below it once again. It's a level not seen prior to the coronavirus panic.
The U.S. dollar erased most of yesterday’s gains.
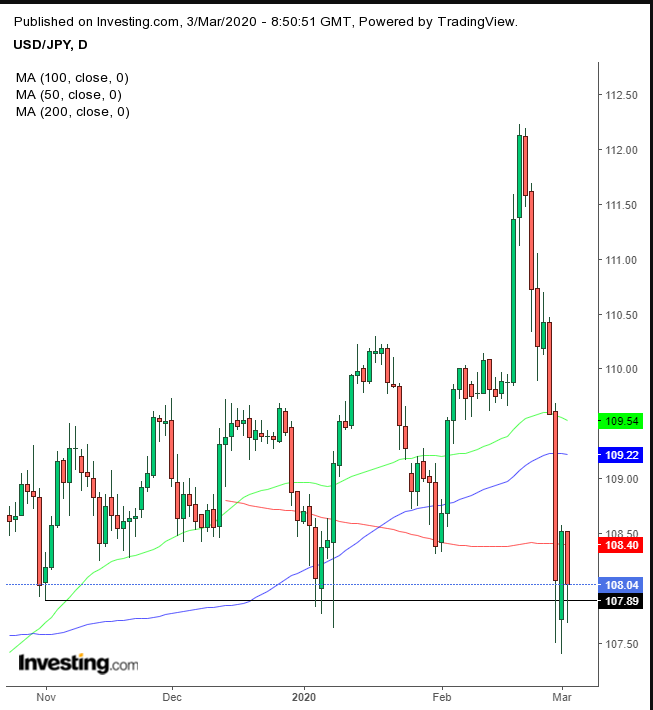
Technically, the USD/JPY is forming a pennant, bearish after the 4.7% dead drop the pair experienced in just eight days, from Feb. 21-28. The pennant’s development is right on the support since November 2019, demonstrating the importance of this price level.
Bitcoin climbed today, gaining 3.6% in the past 24 hours.
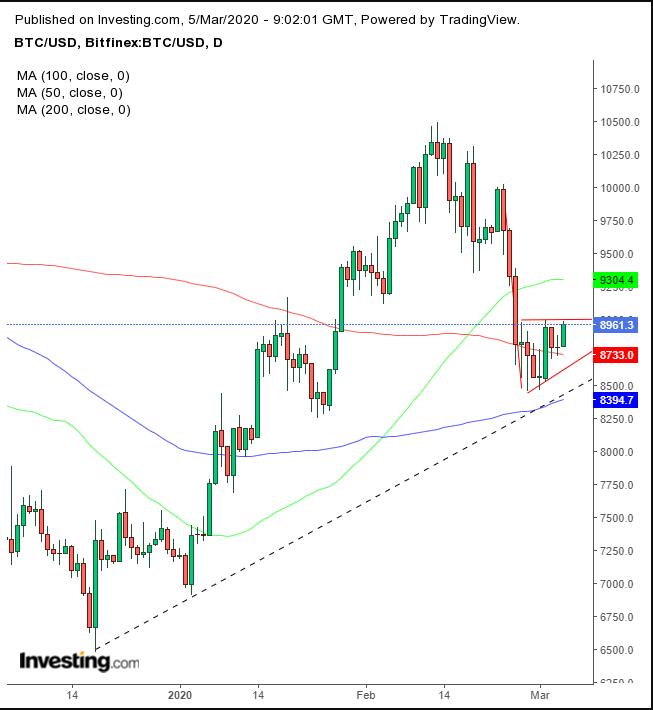
The cryptocurrency found resistance at the top of a bearish pennant, whose development above the uptrend line since mid-December, and on top of the 200 DMA, underscores the level as a technical pressure point. A downside breakout would signal another leg lower, after the 16.6% drop in the five days that preceded the range. The price is currently retesting the pattern top, providing an ideal short from a risk-reward perspective.
Oil edged higher but found resistance for the third straight day at the $47 level, as producers suffer the worst decline in demand on record, leading the commodity into a bear market. Saudi Arabia and Russia remain divided on cutting production in order to boost prices, and short positions have tripled since the beginning of the year.
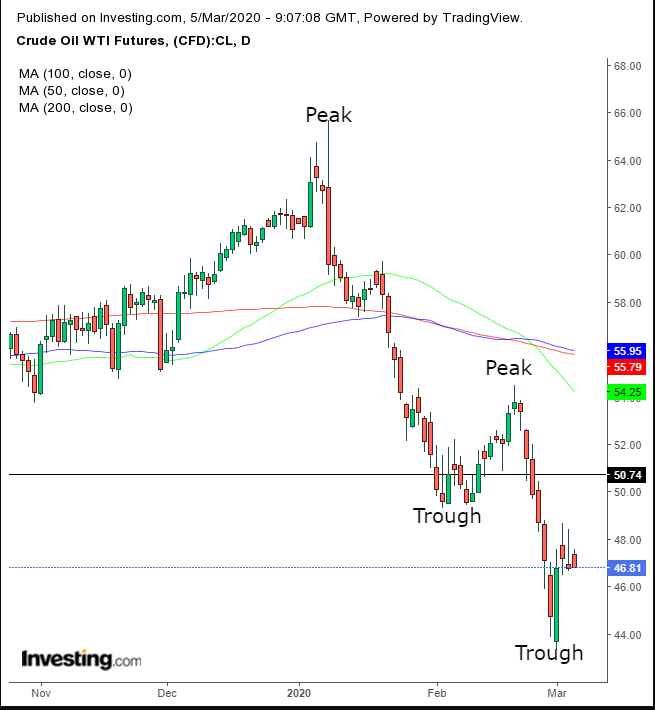
From a technical standpoint, the price is facing resistance after having entered a downtrend, which cut through its $50 support since January 2019.
