Market Overview
There has been a shift in sentiment across major markets this week, driven by a growing sense of exasperation in the trade dispute. There has been a slide in the expectation that a signing of “phase one” could be seen in 2019, whilst Trump’s talk about raising tariffs again has hit risk appetite. The attention will increasingly turn towards what the US does on 15th December, where tariffs are already slated to be increased. The situation is being further complicated by the US Congress passing a couple of bills that denounce China’s interference in Hong Kong. China is clearly unimpressed by this move and it is over to President Trump as to whether the bills are signed or vetoed.
It is though interesting to see the safe havens not managing to sustain traction in the past 24 hours. The yen is not rampant, nor gold and nor the dollar. Markets are taking more of a holding pattern. There has been an initial reaction lower on equities as Wall Street closed lower for a second straight session. However, if bond yields begin to stabilise (tentative early signs today) then a trending move is unlikely. Markets are at an intriguing junction.
Wall Street closed broadly weaker with the S&P 500 -0.4% at 3108. With US futures another -0.2% lower today we have seen Asian markets lower (Nikkei -0.5% and Shanghai Composite -0.3%). In Europe, the corrective momentum shows signs of continuing with FTSE futures -0.4% and DAX futures -0.6%. In forex, we see a very slight risk negative bias but with negligible traction. In commodities, the rally on gold seems to have lost traction too, whilst oil is just edging back lower again after yesterday spike higher on EIA inventories.
There are a few more entries on the economic calendar than previous days this week, but it is still fairly light on key data. The UK public sector borrowing number for October is at 09:30 GMT and is expected to be £8.6bn (much higher than the £5.6bn in October 2018).
The ECB monetary policy meeting accounts (minutes) are released at 1230GMT and focus will be on the potential splits in the Governing Council over easing measures. The US weekly jobless claims at 1330GMT are expected to drop back slightly to 219,000 (down from 225,000 which was the highest since late June).
The Philly Fed Business Index at 1330GMT is expected to +7.0 (up from +5.6). The Eurozone Consumer Confidence at 1500GMT (flash reading for November) is expected to improve slightly to -7.3 (from -7.6 in October). US Existing Home Sales are expected to improve by +1.4% to 5.47m in October (from 5.38m in September).
Chart of the Day – French CAC
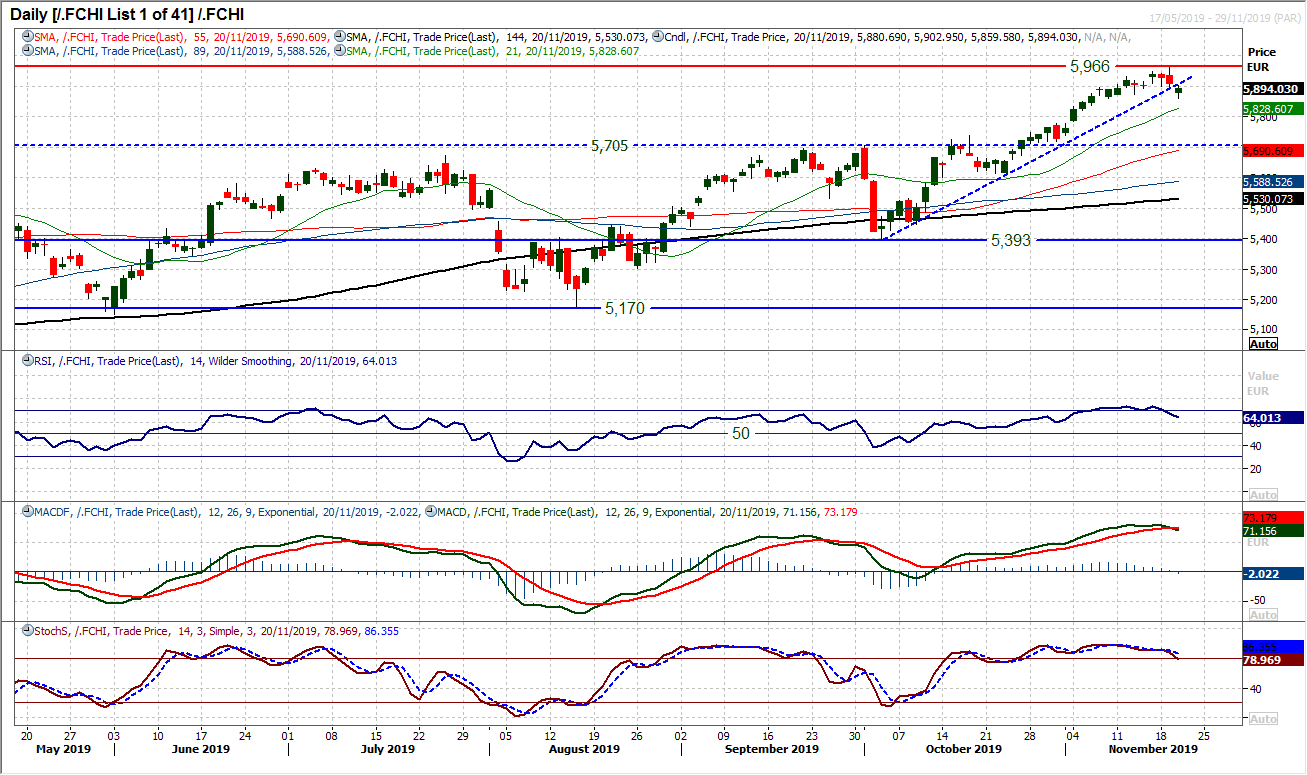
It has been a strong run higher on the French CAC, however, the bulls are on increasingly shaky ground. A trend higher of the past six weeks has now been broken as the market has formed a couple of negative candles followed by another close lower on Wednesday. This trend break comes with momentum indicators slipping back as the MACD lines bear cross lower. The RSI is sliding away and if there is a drop below 60 along with a Stochastics confirm a sell signal it would really be a sign of a loss of momentum in the bull run. An opening gap lower on Wednesday has been bear-filled and the corrective pressure is growing. Could 5966 (the highest traded level since August 2007) now be at least a near term high in place? Profit-taking is threatening, and would grow if support at 5861 were to be breached on a closing basis. The hourly chart indicators deteriorating and increasingly correctively configured. Key support area is 5700/5737.
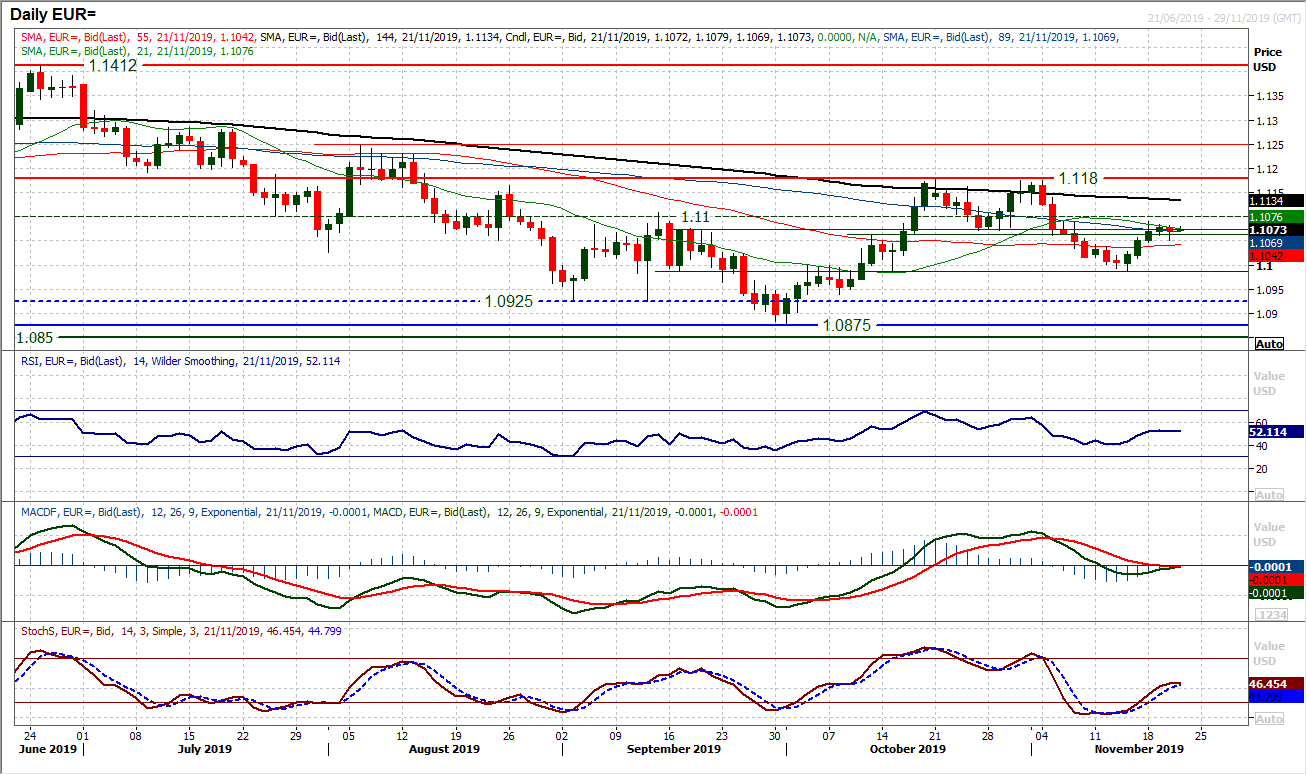
The euro rally has run out of steam in recent sessions, but it is also notable that the dollar bulls have not managed to regain control either. The result has been that EUR/USD is consolidating around an old pivot band $1.1060/$1.1075. What is also notable is that momentum indicators have flattened off around their neutral points, with RSI and Stochastics around 50, and MACD lines almost entirely at zero. This consolidation is reflected in the hourly chart where the hourly RSI has oscillated between 35/65 for the past two days. Resistance is building between $1.1080/$1.1090 as the market searches for direction. Initial support at $1.1040/$1.1050 which is protecting the market from a slip back to the $1.0990 pivot again. However, we are increasingly neutral on EUR/USD between $1.0990/$1.1090.
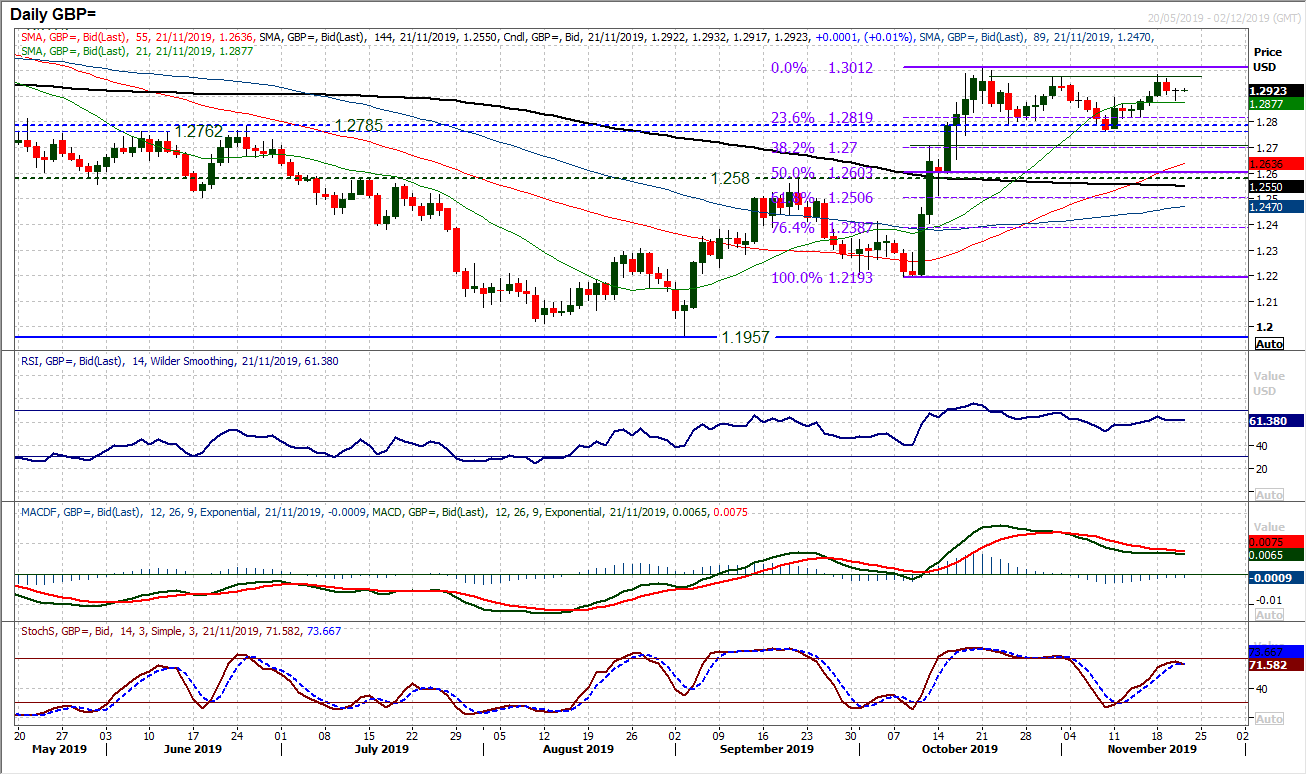
Whilst the sterling rally has tailed off in recent days, it is also interesting to see that there is a lack of dollar buying to drag Cable back. We retain our view that GBP/USD will be in consolidation for the run up to the UK General Election, but for now, the market is holding up well. The resistance band $1.2975/$1.3010 is still the main barrier overhead, but the market is consolidating with a positive bias to momentum. Indicators are taking on an increasingly ranging configuration as both daily and hourly chart signals increasingly lack conviction. Yesterday’s perfect doji candle (rare in forex) is another reflection of this and the moves today again lack conviction. As with the euro, this is a market beginning to need a catalyst again. Clearly the UK election and polling will have a say and need to be watched.
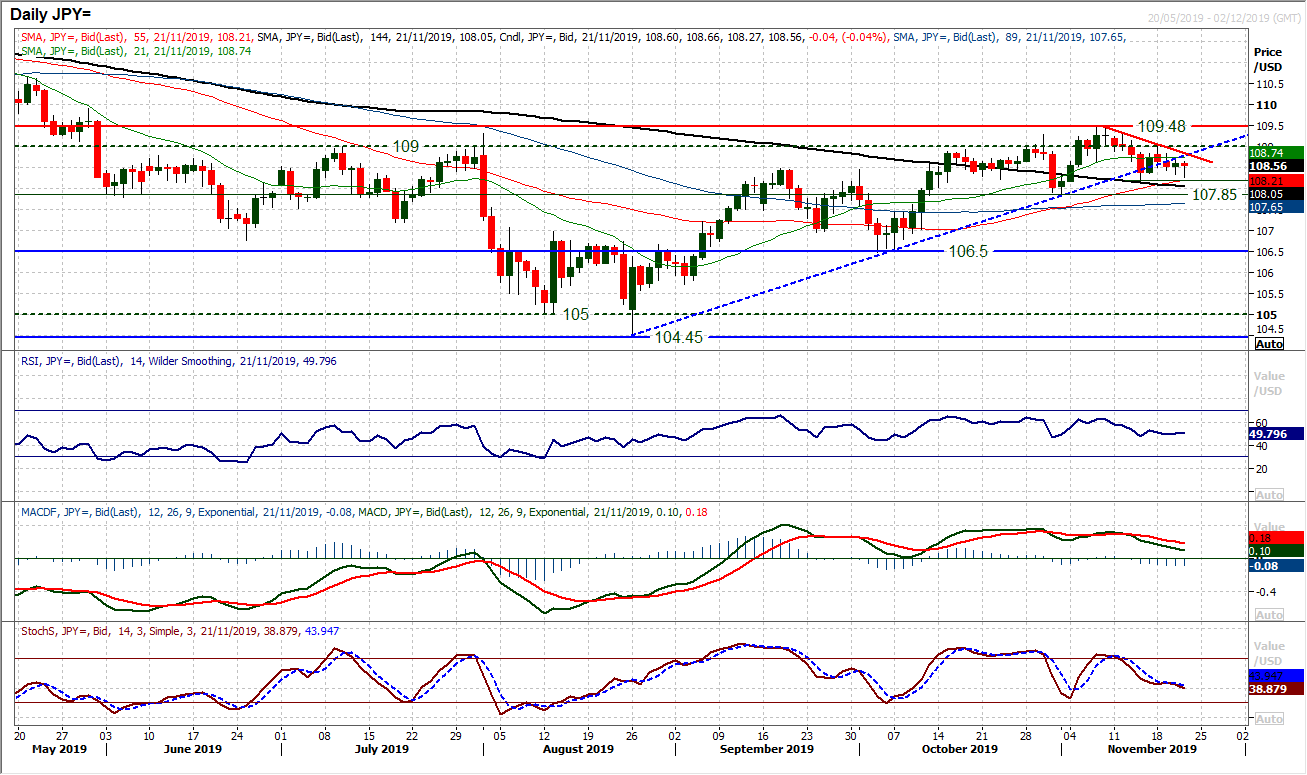
The bulls managed to claw back from what had looked for much of yesterday’s session as a growing corrective outlook. The market held the key low at 108.25 in the end and a mild positive candle has helped to stabilise what had threatened to be a negative outlook. Another look at the support early today in the Asian session has again held firm and whilst this support at 108.25 remains intact, there is still a mixed outlook. However, there is a growing neutral outlook now, having broken the 11 week uptrend. A failure at 109.05 earlier this week is bolstering the resistance between 109.00/109.50, and a nascent downtrend remains intact at 108.85. Momentum indicators are still drifting back to around their neutral points (at least on RSI and Stochastics) and moving averages all flattening. This is becoming a market in need of a catalyst again, with a breach of 108.25 support or above 109.05 resistance needed for direction.
Gold
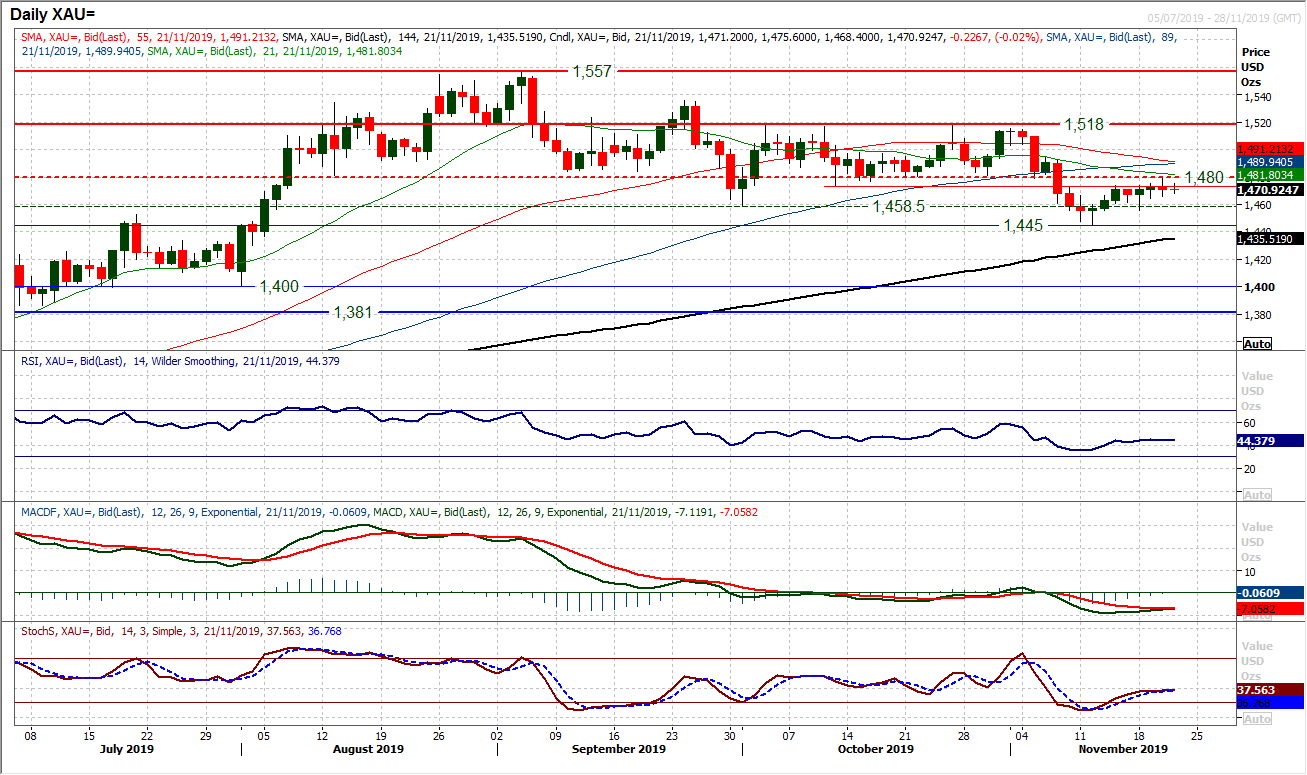
The failure of golf to push ahead in its recovery momentum will come as disappointment for the bulls. Even as safe haven flows have begun to resume yesterday, the gold price closed lower and runs the risk that this tepid rally has already run out of steam. The band of overhead supply between $1474/$1480 has come in to act as a barrier to the recovery and yesterday’s high at $1279 is notable. Momentum indicators are tailing off in their recovery too and the small candlestick bodies shows what a lack of conviction the market has over the past week and a half. We continue to see this recent move to be an unwinding rebound that helps to renew downside potential for what we see as a medium term correction. The resistance of the overhead supply around $1480 runs the potential that this is the extent of the rebound. Support at $1464 and $1458 protect $1445. Above $1494 would give the outlook an improving look.
WTI Oil
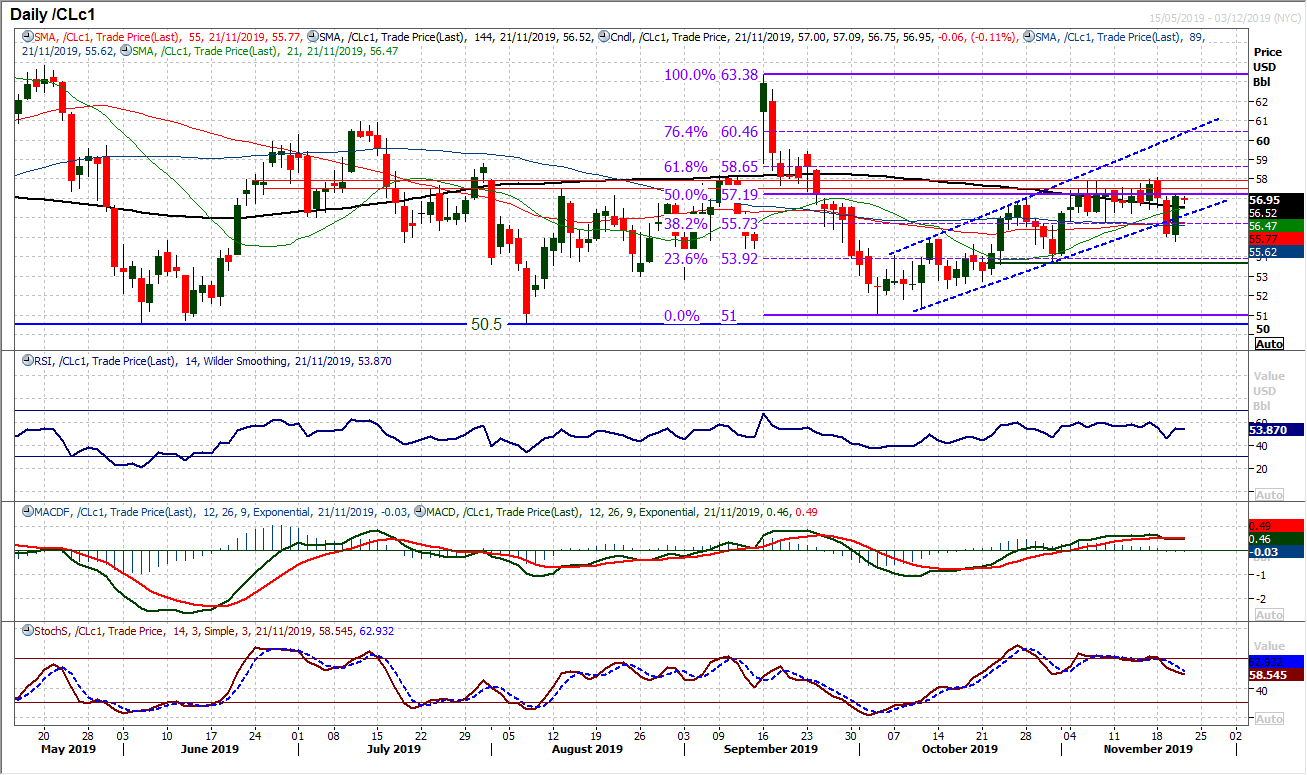
Oil spiked back higher on Wednesday on the EIA inventories data which showed lower than expected stockpiles. From a technical basis this is a volatile period for oil, throwing up mixed signals. Yesterday’s strong bull candle cancelled out the technical implications of Tuesday’s strong bear candle. This is a situation where the dust needs to settle before we can pick up the true picture again. The 50% Fibonacci retracement (of $63.40/$51.00) is a gauge to watch and it was interesting that it came back in as resistance yesterday. There is a legacy of the trend channel breach from earlier in the week and if this channel is quickly breached again soon (by the market falling back again) then there will be a growing sense that the outlook is shifting negative again. Yesterday’s low at $54.75 is also a gauge of support.
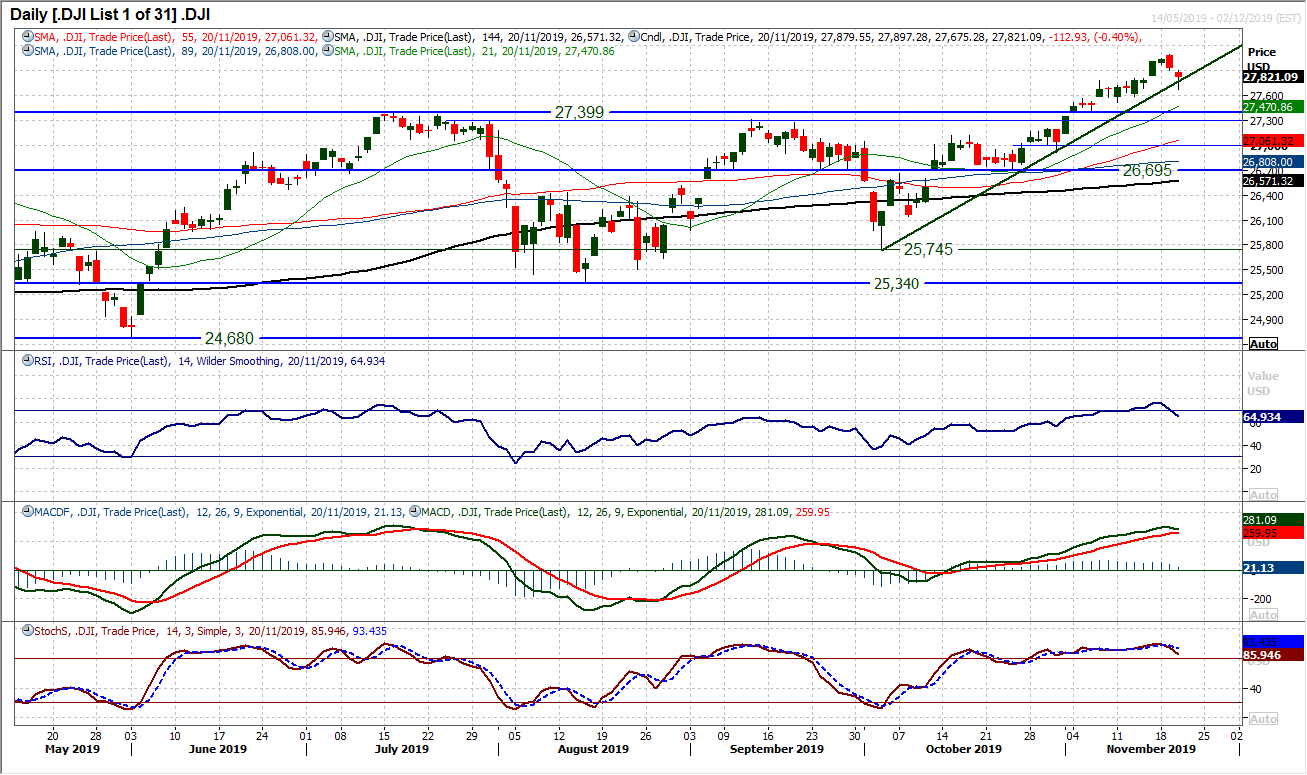
With the Dow closing decisively lower for a second consecutive session (something not seen for over six weeks) the market sits at a key junction. Is this a minor pullback within the bull run, or the start of a deeper correction? Given the propensity for the bulls to buy into weakness, there is not enough on the technicals yet to turn negative. There has been a reaction with RSI back under 70 (the most basic of sell signals) but Stochastics have only marginally turned back and similar on MACD. A six week uptrend was breached intraday during yesterday’s decline, but not held into the close. The sellers will point to a bearish downside gap fill which gives rise to a potential near term pullback. We see the support of the medium term breakout 27,310/27,399 as being a key buffer for any potential downside, whilst initial support is at 27,517/27,600. A pick up into the close of yesterday’s session suggests that the bulls still have an appetite in this market. With futures showing another negative open today, this appetite will be tested again. We see this as a minor near term pullback.
"""DISCLAIMER: This report does not constitute personal investment advice, nor does it take into account the individual financial circumstances or objectives of the clients who receive it. All information and research produced by Hantec Markets is intended to be general in nature; it does not constitute a recommendation or offer for the purchase or sale of any financial instrument, nor should it be construed as such.
All of the views or suggestions within this report are those solely and exclusively of the author, and accurately reflect his personal views about any and all of the subject instruments and are presented to the best of the author’s knowledge. Any person relying on this report to undertake trading does so entirely at his/her own risk and Hantec Markets does not accept any liability. """
