Increasing yields, profit-taking and the upcoming earnings season have meant volatility and pressure for many stocks. Many investors wonder whether they could use inverse or leveraged exchange-traded funds (ETFs) to hedge their portfolios and potentially take advantage of daily moves.
We previously discussed leveraged and inverse funds. Recent research by Colby J. Pessina and Robert E. Whaley of Vanderbilt University states:
"The main attraction of geared levered and inverse funds is that they offer an inexpensive, convenient, limited-liability means for profiting from a directional price view."
The authors, however, also point out:
"The problem with these products is that they are not generally well understood. They are neither suitable buy-and-hold investments nor effective hedging tools. They are unstable and exist only as a mechanism for placing short-term directional bets."
As our previous articles highlight, we agree with their conclusion. Such funds utilize derivative products, including futures, options and swaps. Before investing, it is essential to have a solid understanding of exactly how these products work.
With that information, here are two inverse and leveraged ETFs that could be of interest to experienced short-term traders.
1. ProShares Short S&P 500
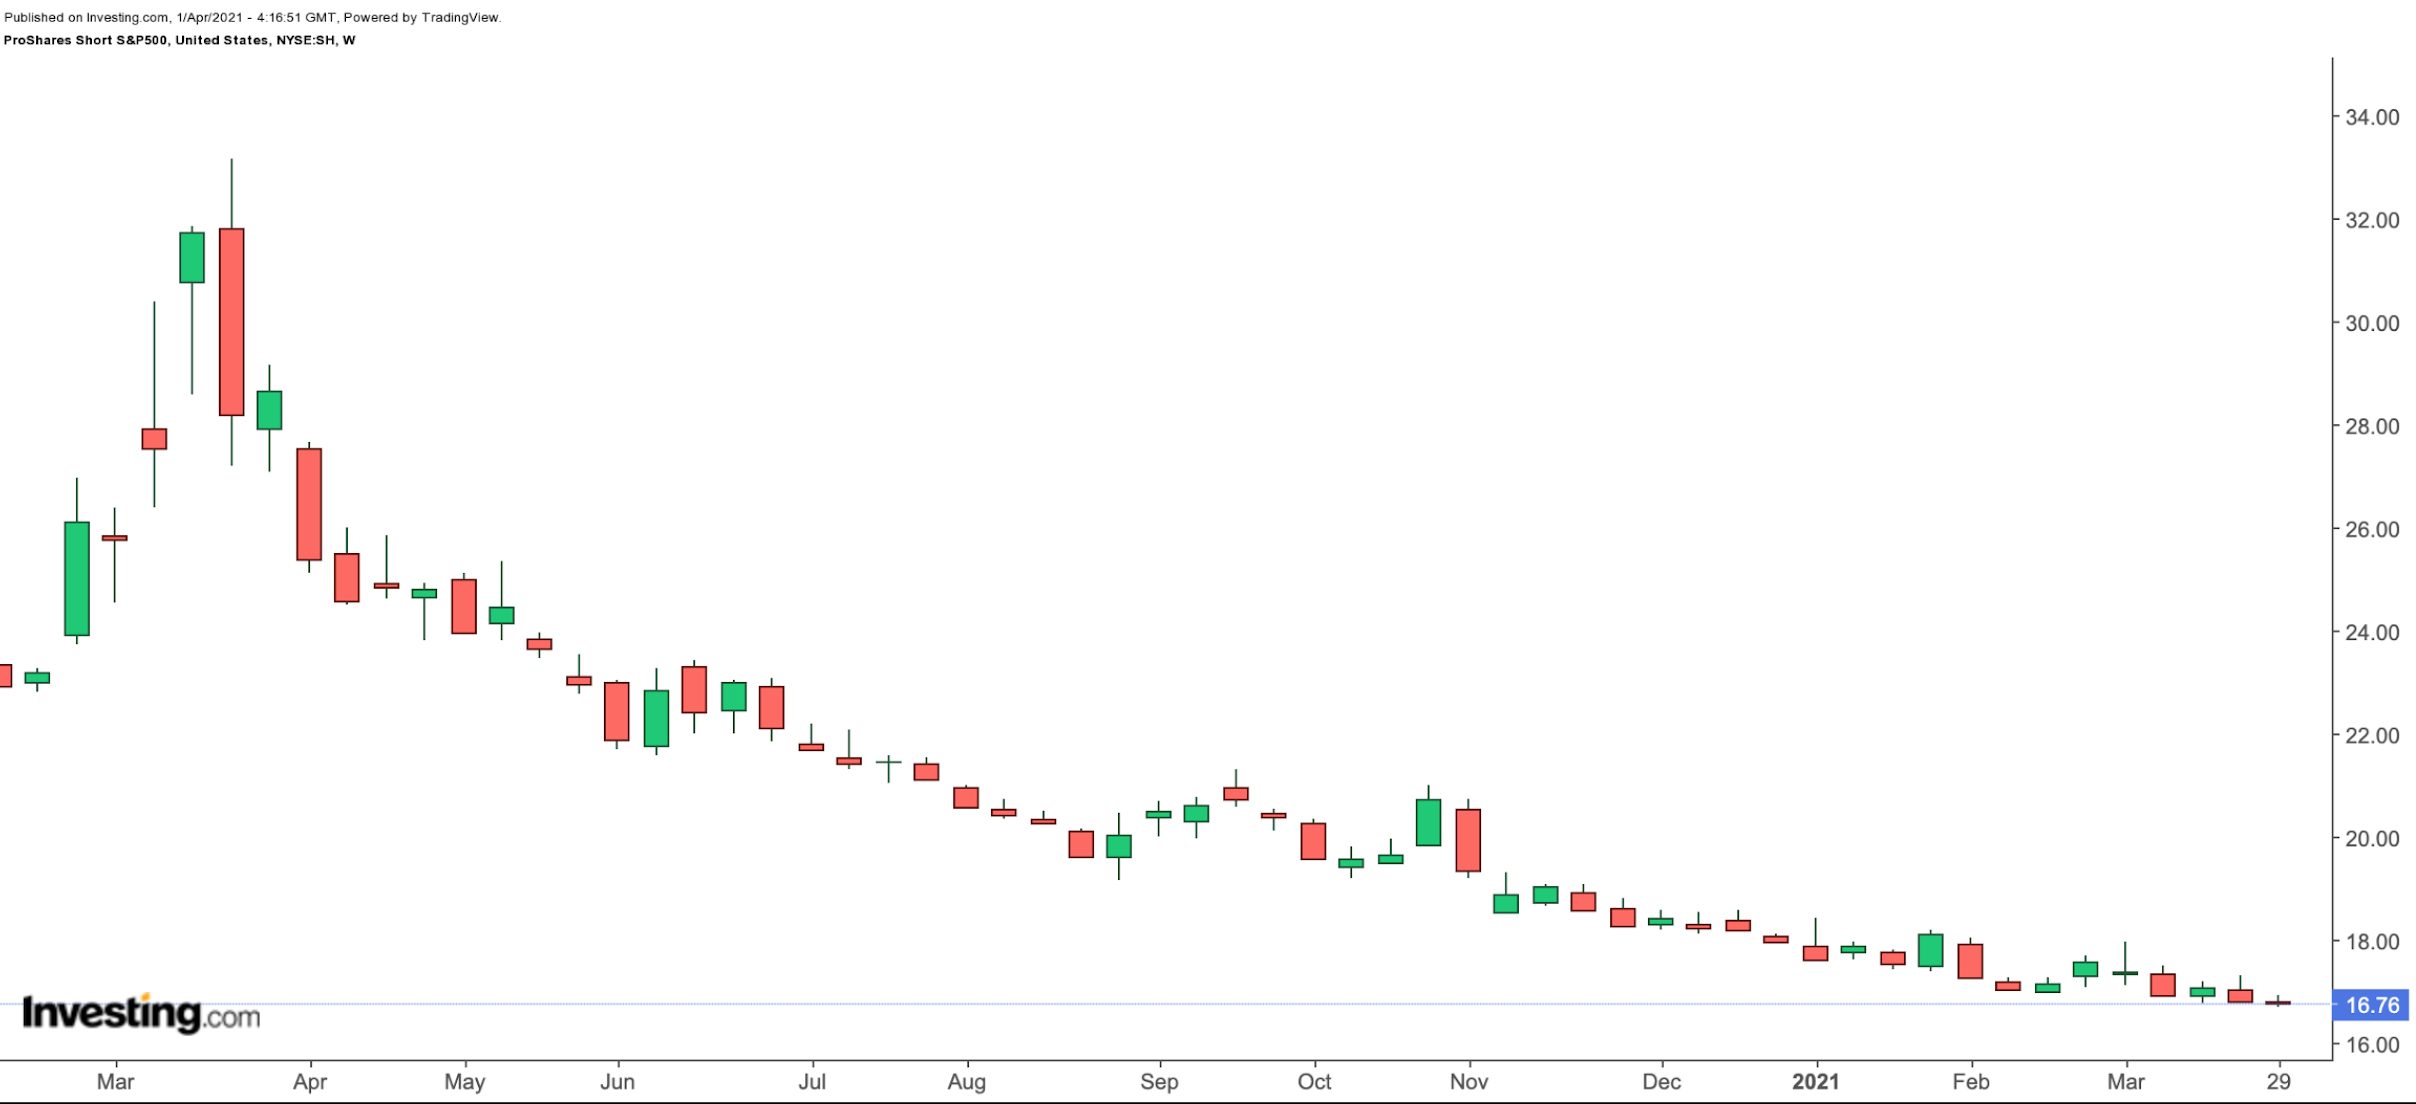
Current Price: $16.76
52 Week Range: $16.75 - $29.16
Expense Ratio: 0.90% per year
The first ETF comes from the world of inverse exchange-traded funds. We'll once again emphasize that while inverse funds can be effective hedging tools for some, they are more appropriate for short-term trading than long-term investing. Therefore, traders would need to monitor portfolios carefully and possibly rebalance positions to maintain the hedge.
The ProShares Short S&P500 (NYSE:SH) seeks daily investment results that correspond to the inverse (-1x) of the daily performance of the S&P 500 index. The fund started trading in June 2006, and net assets stand around $1.5 billion.

Due to the compounding of daily returns, any holding period for longer could easily result in returns that significantly differ from the target. Therefore, for holding periods longer than a trading day, SH may not necessarily move inversely to the S&P 500 index.
To achieve the desired inverse effect daily, fund managers hold derivative products—mostly futures and swap agreements. As a result, over longer periods, time decay and the negative rebalancing effect come into play.
So far in the year, SH is down about 6%. On the other hand, the S&P 500 index climbed around 5%.
Over the past 12 months, SH dropped about 38%, while the S&P 500 increased around 50%. The difference in (inverse) returns is a solid reminder of the fund's daily hedging purpose.
Those who are more experienced with options could also consider devising their hedging strategies using options on the SPDR® S&P 500 (NYSE:SPY), which tracks the S&P 500 index.
2. Direxion Daily Semiconductor Bull 3X Shares
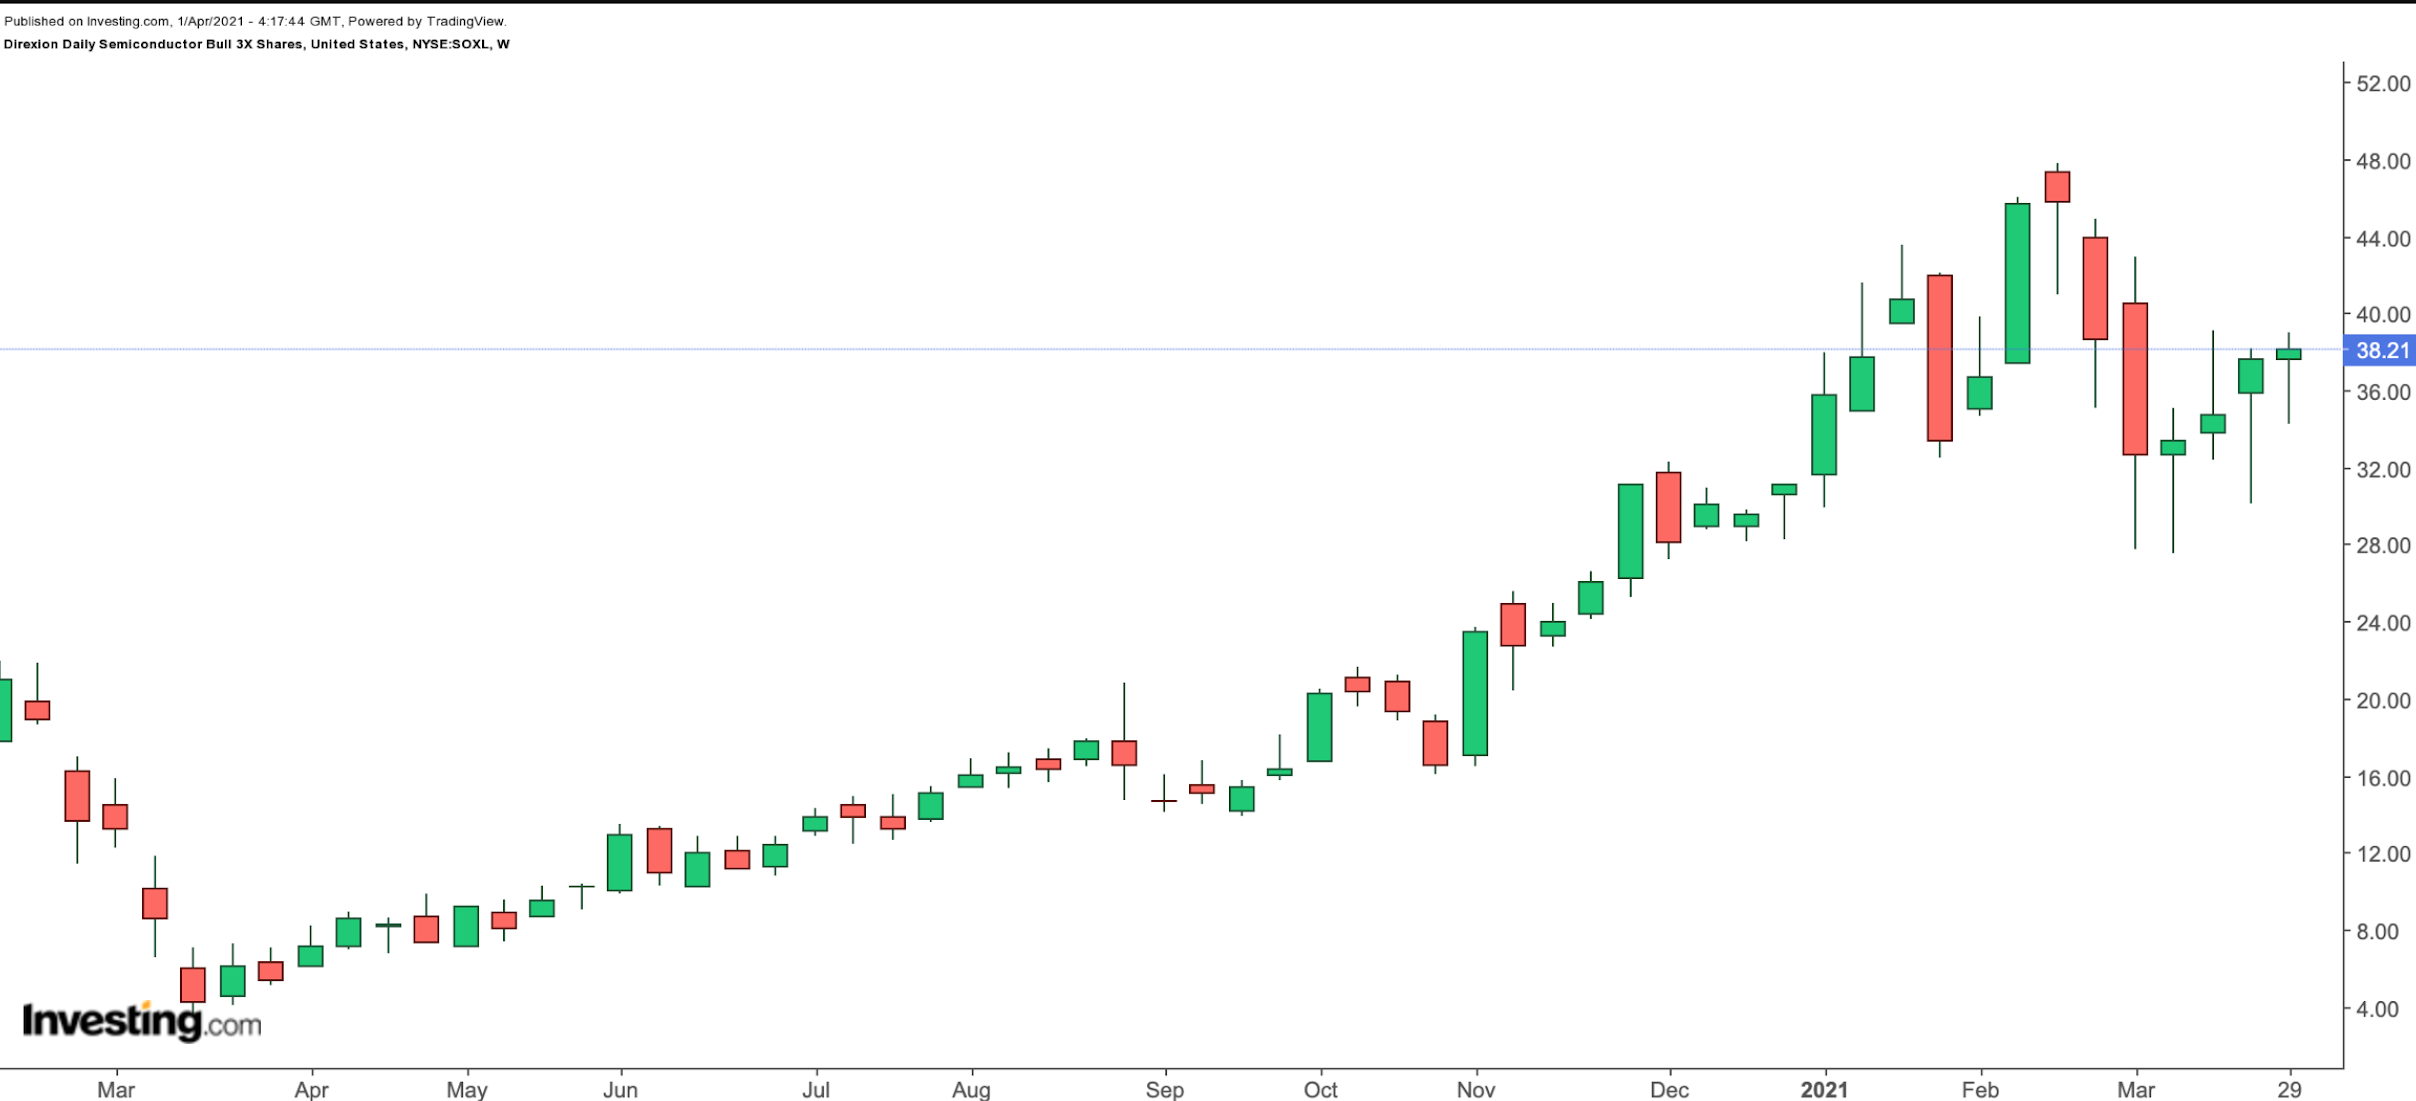
Current Price: $38.21
52-Week Range: $5.11 - $47.85
Expense Ratio: 0.94%
The semiconductor industry, which we recently covered (here), has been in the limelight due to the chip shortage affecting many companies in diverse sectors.
Our next fund, the Direxion Daily Semiconductor Bull 3X Shares (NYSE:SOXL), aims to achieve daily investment results of 300% of the performance of the widely-followed Philadelphia Semiconductor Index.

A long-term investor whose objective is exposure to the benchmark Philadelphia Semiconductor Index would typically invest in a traditional ETF, such as the iShares PHLX Semiconductor ETF (NASDAQ:SOXX).
SOXL, on the other hand, is more appropriate for short-term traders who want to magnify returns on the benchmark index by 3x on a particular day. However, if those traders are on the wrong side of the bet, they would note that the value of SOXL declines quickly when the benchmark declines in value.
So far in 2021:
- SOXL is up about 14%;
- Philadelphia Semiconductor Index is up 9%;
- SOXX is up about 11%.
Over the past 12 months:
- SOXL is up about 420%;
- Philadelphia Semiconductor Index is up 97%;
- SOXX is up about 104%.
The longer-term targeted returns of SOXL are different from the benchmark index due to the compounding effects of the daily re-balancing. We should emphasize that retail traders would need to exercise caution before entering positions with leveraged ETFs.
On a final note, those traders who are short-term bearish on semiconductors could use the Direxion Daily Semiconductor Bear 3X Shares (NYSE:SOXS) for daily directional bets. Since the start of the year, SOXS is down by 89.82%.
