My bottom line:
In August. I posted two major comments on gold/silver with these headings:
- Gold is hot – should you buy?
- Is it time to add gold to your portfolio?
I noted that with bullish mania in full flow with COT showing hedge funds (managed money) holding an 8/1 long-short position, and DSI bulls numbering well over 90% (it was 96% in silver), my best guess was that the rapidly advancing market was heading for a major top – and that the next move would be down – a very hard down.
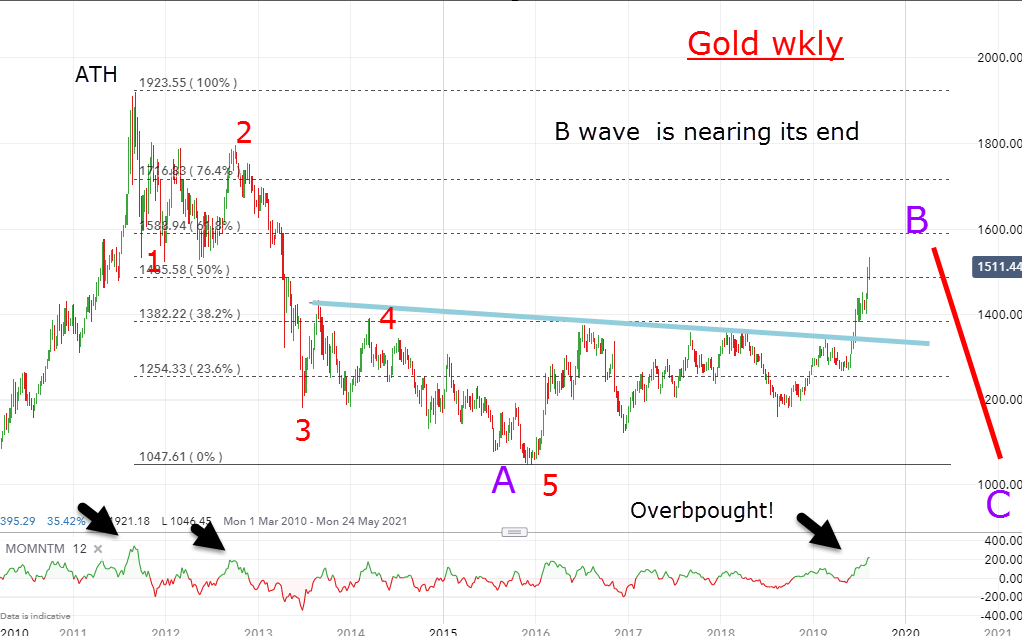
My forecast was based on the wave patterns and also with the firm knowledge that when bullish sentiment becomes extreme, that is when tops occur. This is the chart I showed on 17 August

My target was in the $1500 – $1600 zone for the likely termination of the big B wave. With that expectation the top was near, I was on high alert, And I did not have to wait very long! The high occurred on 4 September at the $1558 level.
In fact, I sent a Flash Alert to my VIP Traders Club members as the price was hitting the $1536 level where we got our shorts away. And this is the current picture
The top formation is interesting for a chartist – I have an ending diagonal five-wave wedge and the break of the pink line was my sell signal. And the final run to the B wave high was on a very large momentum divergence – a sign the reversal would be swift. And so it is with Friday;s close at $1485 – a full $70 below the high in just seven days.
Another feature is the wave 2 bounce to plant a kiss on the lower blue tramline and the Scalded Cat Bounce down off it. This is pure textbook.
And finally, the decline has met my minimum objective to retract to the origin of the wedge at the $1485 region. Again, pure textbook.
So what do I expect this week? Great question! If stocks are making a major high in its D wave (see my Dow coverage), I expect a decent bounce over the next few days provided commodities continue their advances (esp crude oil).
Bank shares have made major lows
Long time readers will know that I have been steadfastly bearish on UK bank shares for a very long time with Lloyds (LON:LLOY) and Barclays (LON:BARC) to the bearish fore. My stance has paid dividends (but not literally!) as short positions have been well rewarded. But is it time to re-assess and even consider taking a bullish stance?
One of the major constraints on the banks has been the minuscule spread margins they have been allowed to make on loans, mortgages, and so on. The MSM is full to brimming of the dire effects of the margin squeeze highlighted by the infamous ‘yield inversions’ in US Treasuries. Bearish sentiment towards ‘lower for longer’ interest rates is running at fever pitch.
The conventional ‘wisdom’ of the pundits has it that because major economies are slowing, interest rates can only go lower as central banks are being forced into applying more ‘stimulus’. But what if they are wrong and that market forces are already on the turn? I have shown before that the Fed, for instance, only reacts to rate changes as dictated by the market – it never leads. And most other central banks take their cues from the Fed. This fact is lost on most economists and analysts.
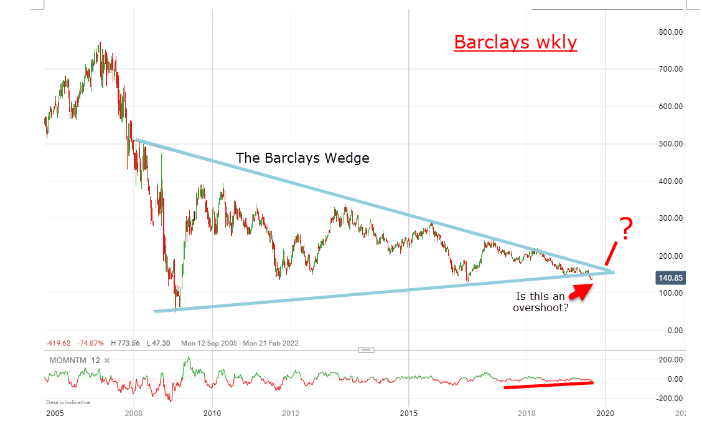
Here is the long term weekly Barclays (LON:BARC) chart showing the wonderful Barclays Wedge;

How the mighty have fallen! Last week, it made a new low at 135p, which was ticks away from a new ten-year low. Ouch! But there are two important features here – first, the large momentum divergence in force for three years and second, the potential ‘overshoot’ of the lower Wedge line.
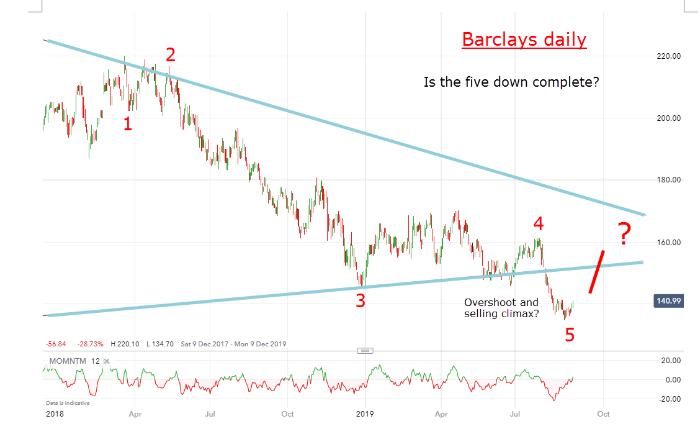
The momentum divergence is a clue that selling pressure is drying up and the overshoot – if it comes off – an indication that last week saw a selling climax that sets the stage for a huge rally phase. Here is a close-up of recent action:

From the latest hit on the upper Wedge line, the market has descended in five Elliott waves (that may or may not be complete). Remember, fifth waves are ending waves prior to a reversal.
This sets the scene for a reversal of fortune – just as bullish sentiment is on the floor (after months of a big bear phase). We are seeing a plethora of MSM articles explaining why the shares ‘fell 11% in August’ to add to the gloom, and why the PPI pay-outs could be much greater that thought. In addition, both Lloyds (LON:LLOY) and Barclays (LON:BARC) are now being downgraded by analysts – a comforting thought for we merry band of contrarians!
Bombed-out sterling jumps back to life!
Just when the world believed cable was heading for parity with the dollar as Brexit loomed large last week, it staged a most remarkable recovery.
Once again, sentiment has reached an extreme and conditions were ripe for such a sharp rally. In fact, if all you had for a trading method was to fade markets where sentiment was extreme, you would have a far superior tool at your disposal that 99.999% of all other traders most of which trade off the news, such as the algos used by most hedge funds.
You will note that I rarely mention the ‘B’ word when covering the pound. You can take it from me that all of the output of the ‘experts’ and pundits on this topic is so much hot air.
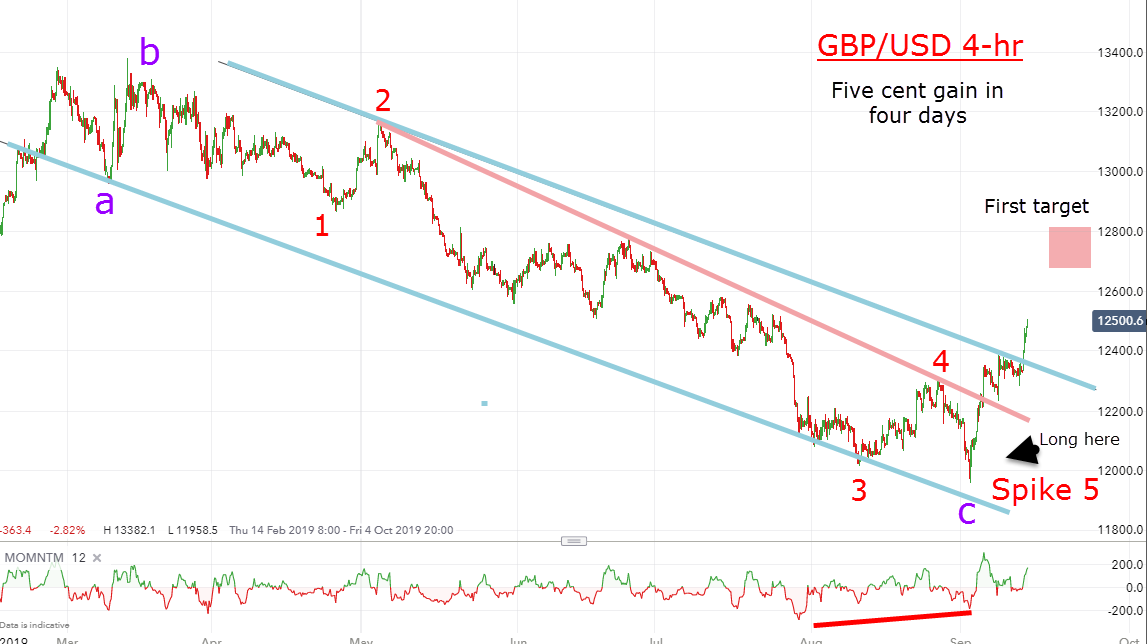
The ECB report last week was instructive as they lowered their policy rate by a smidgeon and messed around with more QE. That initially knocked the euro (but it quickly recovered) but sterling actually advanced on the report, which aided our short EUR/GBP trade enormously. Here is the sterling chart I used to guide my trading

A very nice a-b-c down with a clear five down in wave ‘c’ and to a large momentum divergence. All is set for further advances.
We are now well into September and I fully expect major moves in most if not all of my markets up to the end of the year (and beyond).
