I have waited and waited and waited for the PMs to begin major turn-arounds from their deep bear trends off their March highs. And so far, to no avail. It has been an exercise in total frustration especially for Gold.
Since July, odds have been rising rapidly for imminent turn-arounds. Bullish sentiment was in freefall (usually a good sign bottoms are close) and the chart patterns and momentum divergences were lining up encouragingly.
And all I got were a few false dawns! But now, with odds reaching irresistible levels, are we now at the major lows that would herald major advances – and huge profit? Here are some of the factors that yell yes.
Here is Gold’s weekly chart
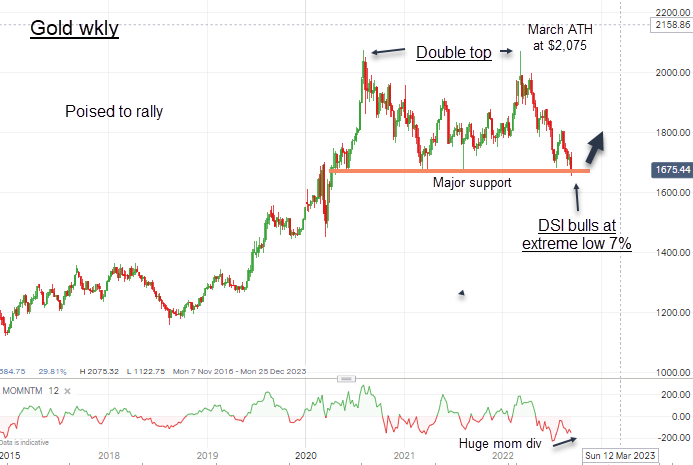
The market has declined off the March Double Top at the ATH $2,075 to the low yesterday at $1,655 ( a loss of $420, or 20%) and into major long term support and on a strong mom div. And the persistent selling has produced a very low DSI bull reading of only 7% last week. That is at a level where rallies have previously emerged.
Here is a close-up on the daily
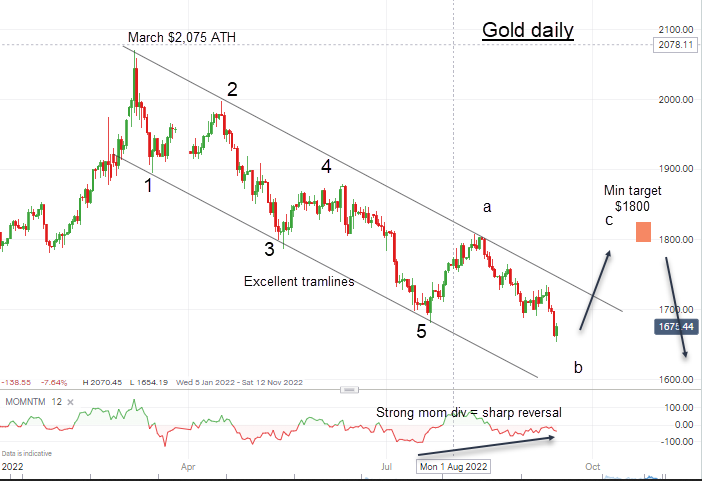
The decline off the March ATH has been channeled by my excellent tramlines and yesterday reached the low at $1,655 on a very strong mom div.
So is this the elusive major low prior to a massive rally phase? Odds have swung overwhelmingly in its favour.
Also, the much neglected gold miners have also taken quite a beating but are showing signs of a recovery already. Here is a favourite Agnico Eagle
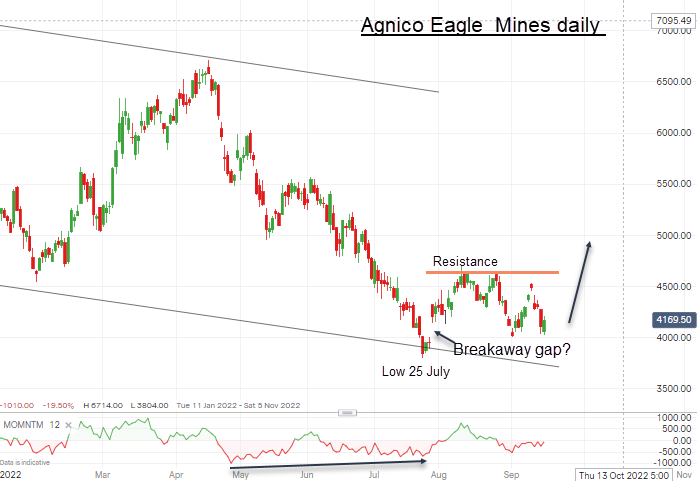
Note the low was made almost two months ago on my tramline and has been building a base since – and note the gap which turns into a definite ‘breakaway gap’ if the shares can rally from here to test the pink resistance – an beyond?
And over in Silver, its low was made on 2 September which makes Friday’s new Gold low a non-confirmation of the bear trend (also seen in Palladium and Platinum). The new Friday Gold low is the odd man out – and when it plays catch-up, the recovery will be swift.
If so, then I expect a rally phase now to at least the $1,800 area and perhaps above. But this is a ‘c’ wave that would complete the bear market a-b-c rally (the Double Top is the dominant long term pattern and that points to much lower prices long term).
Of course, many PM bears are taking their cues off the upward trend in interest rates as they believe high rates spell bad news for the PMs. They have closely followed the Fed’s actions and hawkish ‘guidance’. Many now believe they may well hike by 100 bps next week based on last week’s ‘surprise’ advance in the inflation data. I believe this extreme view is already in the PMs and so any less apocalyptic action on the Fed’s Wednesday doings could well induce much short covering.
And latest weak retail sales data in the UK at least should be having a dampening effect on final demand and hence on consumer price levels – and so the next USA CPI (and PPI) data points may well be ‘misses’ – and big ones. And potentially bullish for assets.
Thus, the bears now have very high hurdles to jump in order to keep their bearish hopes alive.
Also, the long range T-Bond charts strongly suggest yields are reaching levels compatible with a major turn lower. Of course, most believe rates and yields can only go up now with the Fed cheerleading the path. That may turn out to be a mistaken view.
Remember, markets exist to disappoint the majority (eventually!) and big disappointments occur when the herd is largest, strongest and most vociferous with very firm views (as relayed by the MSM).
And that is why I study the technical pictures that often reveals the precise points where the herd is trapped and the gate closes shut. Much pain and anguish ensues – and those that saw it coming are well prepared to take full advantage.
The word ‘speculator’ comes from the Latin ‘speculare’ – to see ahead, hence ‘spectacles’.
Assets have been falling more or less together
Since the time when interest rates started climbing from the zero bound, liquid assets have been more or less falling in synch from Bitcoin to Tesla to share indexes to Treasury bonds to PMs. That has been true for liquid assets (can be immediately turned into cash).
But not so much for illiquid assets such as real estate. Here, there are different dynamics but certainly if a bear stock market is foretelling of an economic contraction ahead, real estate prices succumb to the inevitable. eventually.
But going against the bearish trend was the auction last week of Michael Jordan’s shirt that sold for way above estimate (although auction estimates are kept deliberately low to entice bidders). The $10 million was the highest paid for a piece of sports memorabilia – amazing.
So if my bullish prognosis for the PMs is to have legs, I would prefer to see at least a pause in the T-Bond bear trend – and a pause in the stock index downtrend.
How likely is that when the MSM is screaming Recession for the USA and UK and especially Europe? Let’s take a look at the S&P:
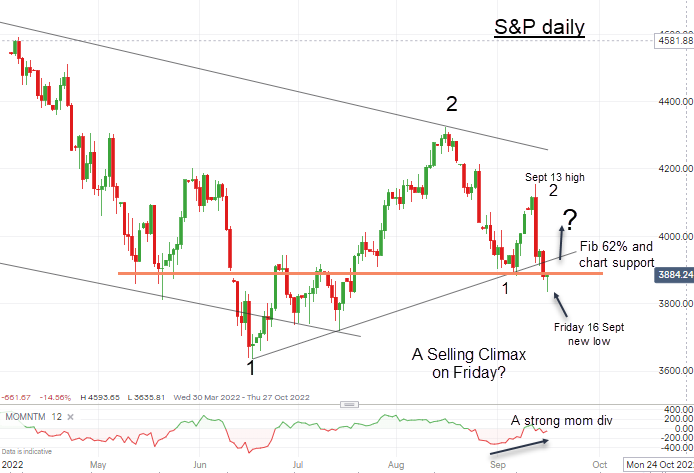
It made a new low yesterday and on a strong mom div and just below the major trendline joining recent lows. And towards the close, it rallied. Undoubtedly, some of that buying was short covering ahead of the weekend, but if we see a firmer tone early next week into Wednesday’s Fed meeting, more of that should be on the cards.
In EW terms, yesterday’s decline to the 3836 low could be a Selling Climax and the end of a small degree wave 1 which would lead to a three up wave 2 taking it back to ‘kiss’ the underside of the trendline and even somewhat above it.
Here is a closeup of that little question on the 4-hr
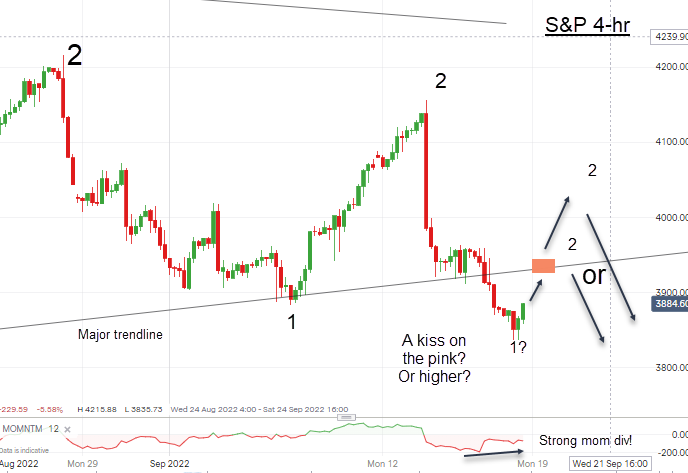
When the major trendline was broken, the market had the option of reversing back to plant a traditional kiss on the line and then either peel back down in a Scalded Cat Bounce – or move back above the trendline. Sadly, there is no way to determine that outcome beforehand, but one possible clue lies in the large mom div set at Friday’s low. That places the odds for a kiss on the pink (a snooker term) – and possibly a move above it – on firmer ground.
So with the market firmly expecting a bearish Fed stance on Wednesday, could it possibly be in for another massive surprise?
But stock trends are very much down – could this be another bear market rally? If so, it will test the nerve of we bears if it stretches up as it did June – August.
But is Lloyds (LON:LLOY) showing the way ahead?
I have been a trader of this major UK bank for some years and cover it extensively for Interactive Investor in my Chart of the Week articles. We are actively trading it in my Pro Shares service.
And the shares have been advancing of late – here is the weekly
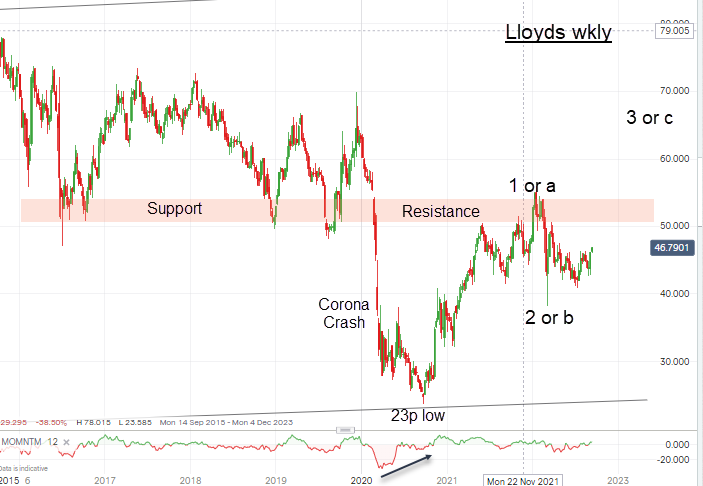
Note that both Lloyds and Barclays (LON:BARC) have been advancing despite the weakness in the FTSE 100. I believe the market considers the rapidly rising mortgage rates with expanding profit margins from lending will more than compensate for any reduction in the volume of new business the approach to a recession would imply.
Margins were paper thin when the bank rate was on the floor. Now rates are around 3%. Also, government gilts are paying much more – and investors such as the banks are receiving these higher payments.
This is the ‘new normal’ and with bank shares slowly recovering from the near wipe-outs of the 2008 Credit Crunch when the banks were in deep peril but were ‘too big to fail’, any glimmer of earnings hope will translate into the share price.
But the elephant in the room remains the still high inflation rate that destroys savings – and governments must do something – and be seen to be doing it. We await policy decisions nest week from the new Truss government that should have high impact in the financial world.
