Stock markets rose in early trade as investors parsed the latest signs of inflation and the central bank reaction function, whilst earnings season has got underway across the pond with some decent numbers from JPMorgan (NYSE:JPM). Wall Street rose mildly, snapping a three-day losing streak. VIXX is off sharply, which maybe reflects increasing comfort that the market has stabilised, if not able to make new highs just yet.
Earnings season gives investors a chance to ignore some of the noise and market narratives and get into actual numbers. Only this time we expect the corporate reporting season to underline the inflation narrative – the question is whether it’s just inflation or stagflation. Probably we get a bit of both – watch for sandbagging. JPMorgan numbers were positive, but as ever the stock fell despite beating on the top and bottom line. Profits were boosted by better-than-expected loan losses. Trading revenues were robust, asset and wealth management strong, loan growth improving and likely to pick up in 2022. Delta Air Lines also posted numbers that topped expectations including a first quarterly profit ex-state aid since the pandemic. But higher fuel costs and other expenses will hit the fourth quarter profit – shares fell over 5%. Today sees Citigroup (NYSE:C), Bank of America (NYSE:BAC), Morgan Stanley (NYSE:MS) and Wells Fargo (NYSE:WFC) report.
Chinese producer price inflation rose 10.7% in September, the highest level since 1996. The China PPI number is an important leading indicator for global consumer inflation. On that front, US consumer price inflation accelerated in September to 5.4%, with prices up 0.4% month-on-month. Core rose 0.2% from August, leaving prices ex-volatile items like energy and food at 4%. US PPI inflation today is seen at +0.6%, +0.5% for the core reading.
Minutes from the Fed’s last meeting indicated the US central bank is likely to commence tapering asset purchases next month. “Participants generally assessed that, provided that the economic recovery remained broadly on track, a gradual tapering process that concluded around the middle of next year would likely be appropriate,” the minutes said.
Post the CPI and FOMC minutes we see Treasury yields lower, the dollar lower, gold firmer. Lower bond yields lifted megacap growth, or at least provided some marginal buying excuse to do so. Inflation is still hot but not getting much hotter. Narrative has clearly exited team transitory to support team sticky. The question now is whether we are at peak in/stagflation fears and this allows the market to move on to start pricing for 12-18 months hence, by which time you’d feel a lot of the post-pandemic bottlenecks and pressures will have eased. The problem for this – still team transitory if you like – is that anything that raises the costs of getting goods from source to consumer is inflationary and the pandemic has certainly been that. But so too is the shift in globalisation trends, eg Brexit.
Sterling is firmer as the dollar weakened in the wake of the CPI report. GBP/USD has broken free of the trend resistance and with bullish MACD crossover in play. Bulls would like to see the previous two highs on the MACD cleared (red line) to confirm reversal of the downtrend since May.
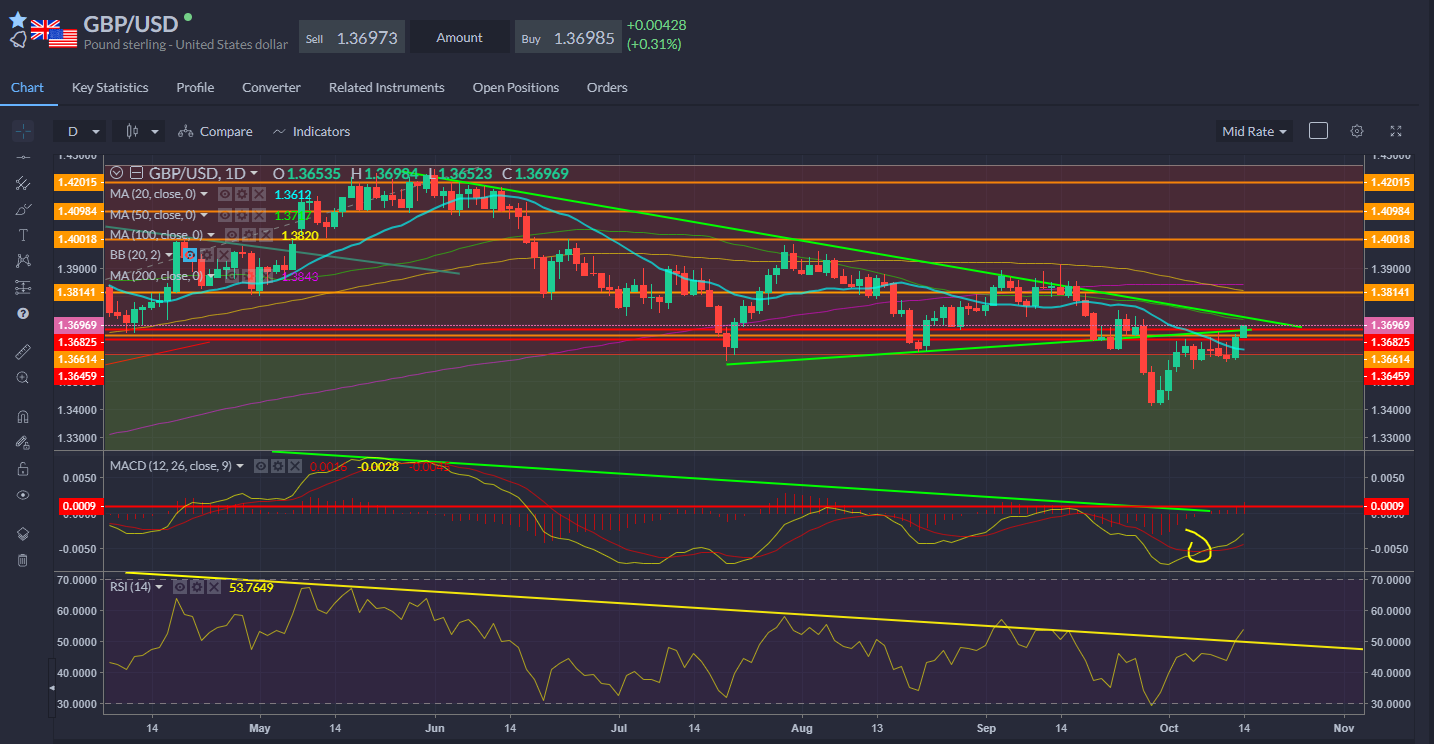
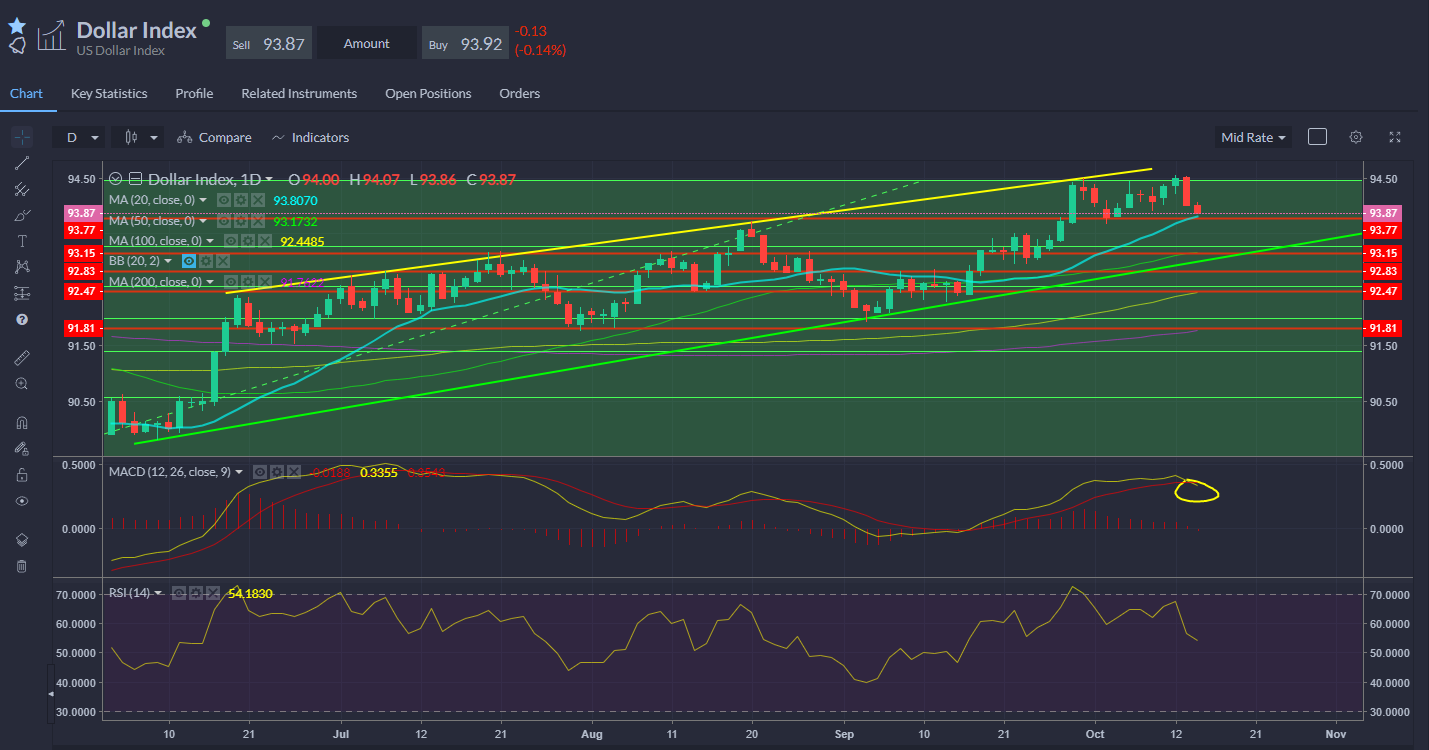
Chart: US Dollar Index easing back to the middle of the channel, but faces pressure from bearish MACD crossover.
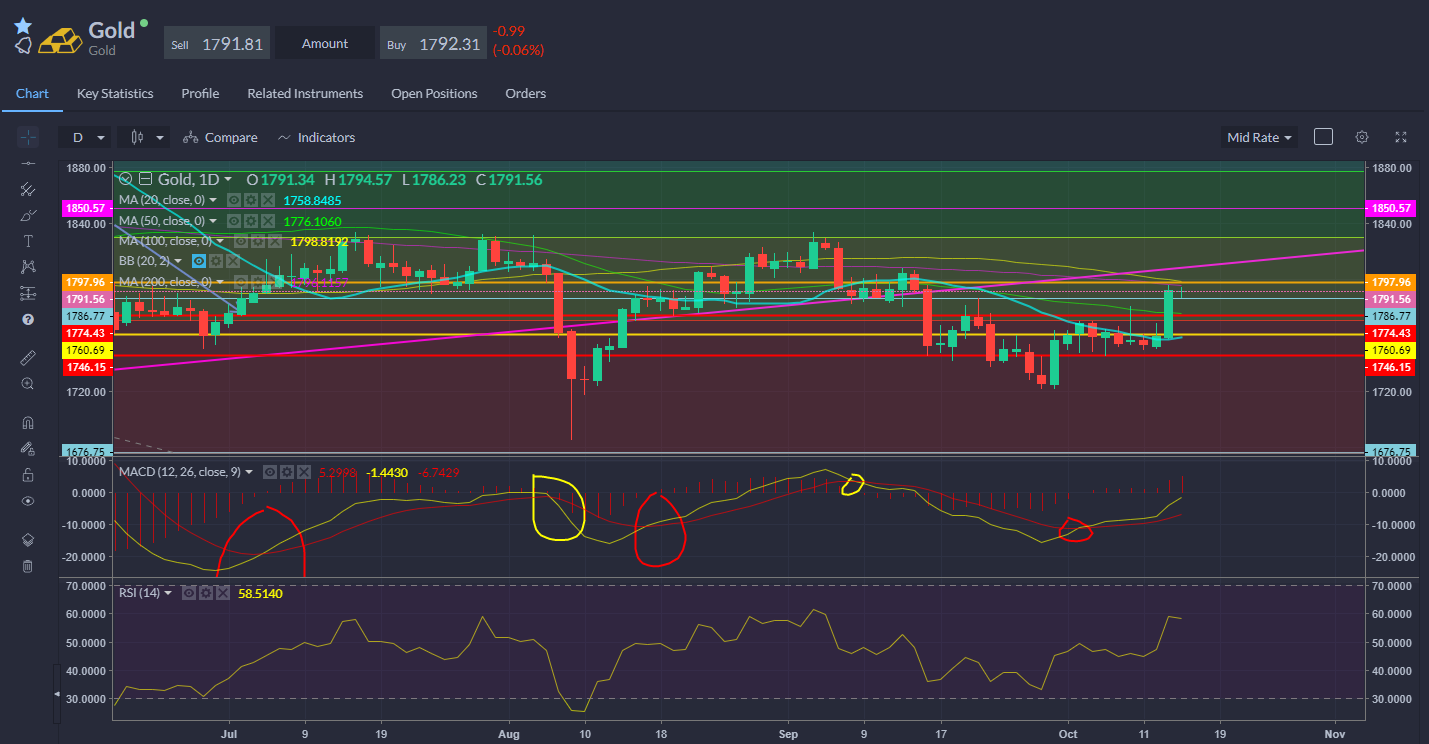
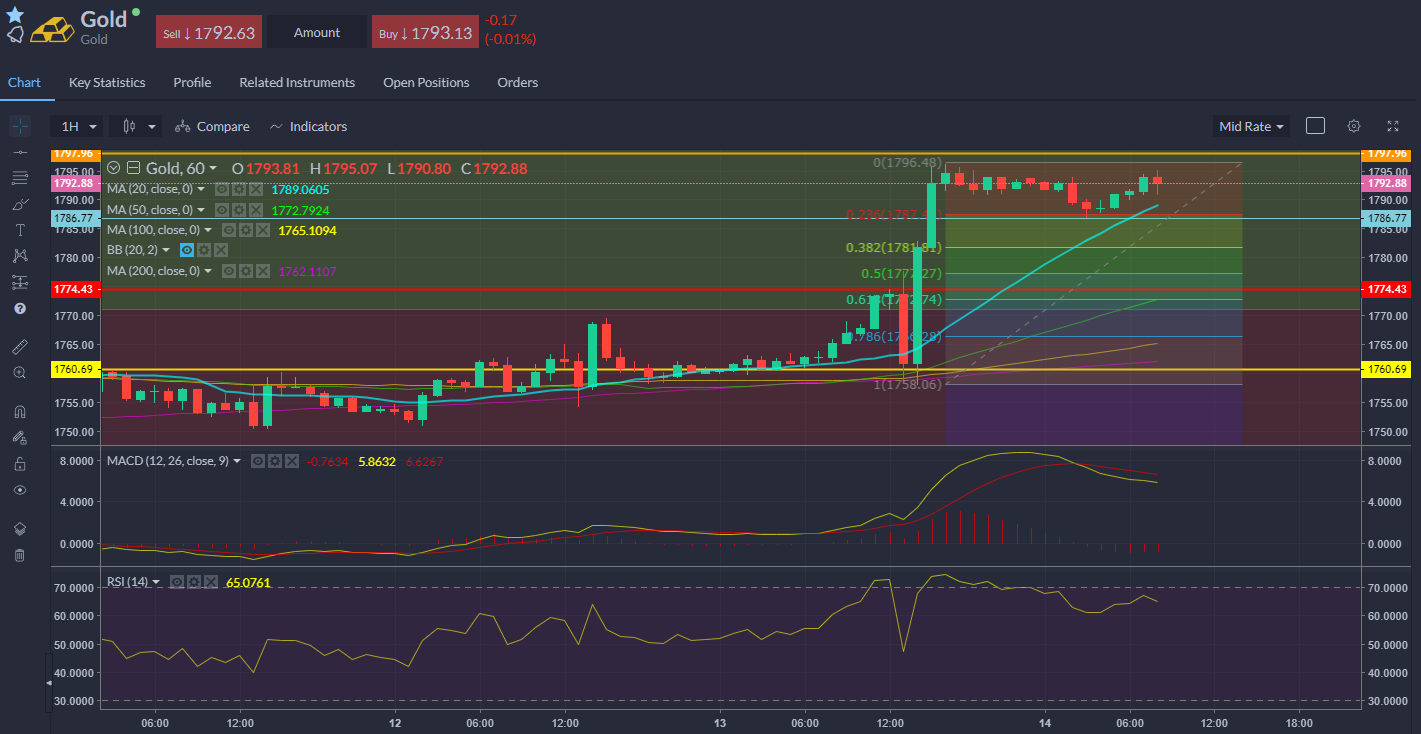
Yesterday I noted that gold was likely to face some volatility and break free from its recent consolidation. CPI numbers were indeed the catalyst and we saw gold prices hit the highest in a month, approaching $1,800 before pausing. Near-term, consolidation again with the 1hr chart showing a clear flag pattern with the lower end capped by the 23.6% line.
Oil has firmed, with WTI recovering the $81 handle, though price action remains sluggish and sideways for the time being. OPEC yesterday cut its global oil demand growth forecast for 2021 but maintained its 2022 view and cautioned that soaring natural gas prices could boost demand for oil products.
OPEC cuts its demand growth forecast for 2021 to 5.82 million barrels per day, down from 5.96 million bpd. As we noted some months ago, it was always likely that OPEC would need to trim its 2021 forecast since it had always backdated so much of that extra demand to come in H2. The original 6m bpd forecast implied 1m bpd in H1, 5m bpd in H2, which always seemed optimistic. Critically, though, it was not wildly optimistic – demand has come back strongly after shrugging off the summer Delta blues. The cartel maintained its 4.2m bpd growth forecast for next year. EIA inventories today – a day late due to the Columbus Day holiday – forecast 1.1m build.

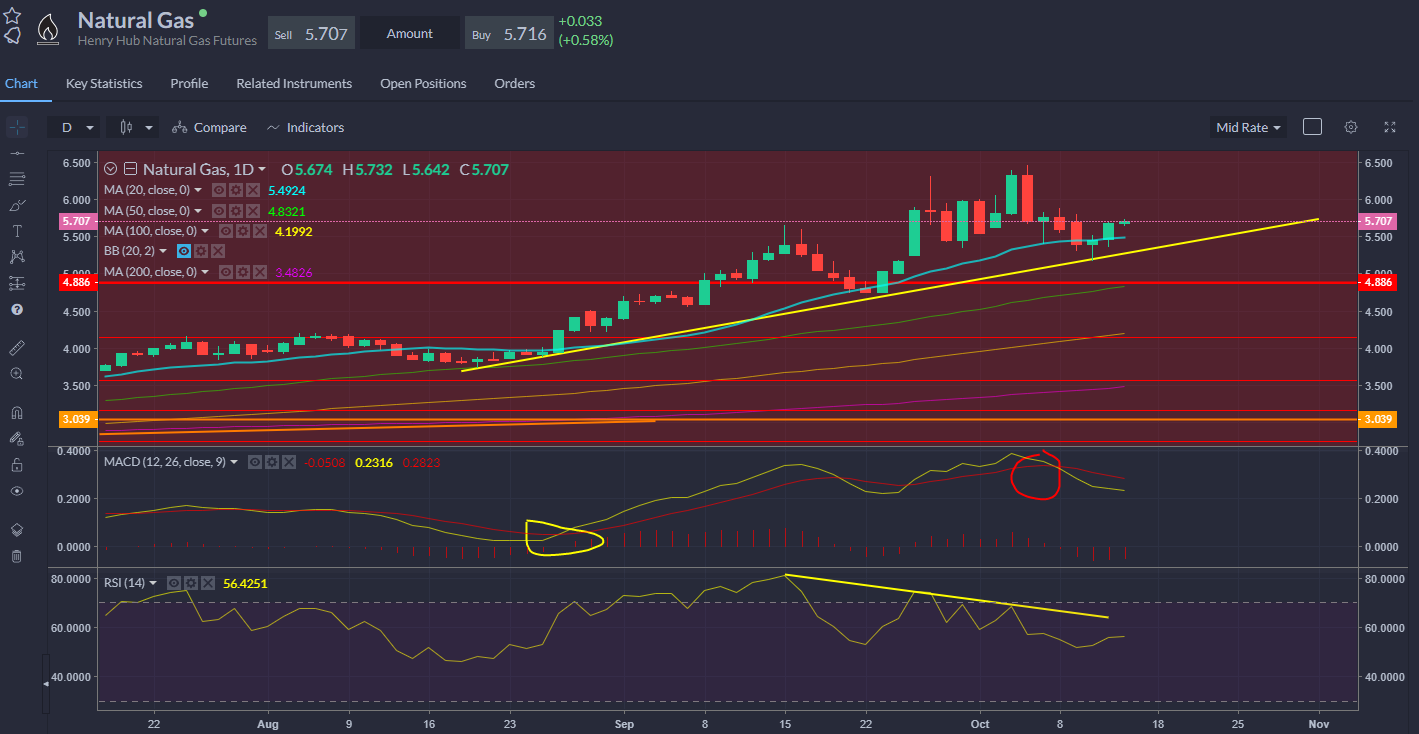
Nat gas – holding the trend support and 20-day SMA, bearish MACD crossover still in force.
Stocks we are watching
Hays (LON:HAYS) shares +4% as fees rose 41% from a year ago. Strong leveraged play on record numbers of job vacancies and staff shortages. Shares have been flat the last 6 months, though +17% YTD, +45% the last 12 months leaves not a lot of room left on the table.
Dunelm (LON:DNLM) still performing strongly against tough comparisons. Total sales in the first quarter increased by 8.3% against a very strong comparative period in FY21, when sales grew by 36.7%. Gross margins were down 10bps and expected to be 50-75bps lower than last year for the full year. Management warned on supply chain problems and inflation but stressed that good stock levels should provide them some cover. Some way to go to for the shares to recover recent highs but encouraging signs.
