Market Overview
There is an almost daily swing on market sentiment as traders grapple with the bigger picture implications of COVID-19. The dissemination of newsflow out of China is looking to be more positive. Although the total number of deaths has topped 2000, the numbers of daily new cases and deaths are now falling. Furthermore, the official information is that Chinese businesses are getting back to work following weeks of shutdown and quarantine. Traders are faced with a dilemma of whether they can rely on the official data. Levels of pollution and electricity usage have been often used as more reliable gauges in the past and will need to be watched as to whether they marry up with the official data. It does seem as though knee-jerk reactions to bad news (Apple’s revenue warning being the latest) tend to last for a day or so before traders refocus on the dovish leanings of central banks and a continued tendency to “climb the wall of worry”. For markets, there is a more settled outlook to sentiment forming today.
Through all of this, the dollar remains a go-to destination of capital choice, whilst gold is also playing strongly. What is interesting though, is that sentiment on the oil markets has turned a corner, with an appetite to buy into weakness now increasingly prevalent.
Wall Street closed lower last night with the S&P 500 -0.3% at 3370. However, with US futures looking perky today, around +0.3% back higher, this is allowing a decent Asian session (Nikkei +0.9%, Shanghai Composite -0.3%). European markets are taking this positively, with FTSE futures +0.7% and DAX futures +0.6% pointing to decent early gains today.
In forex, there is a positive risk skew to majors, with JPY underperforming and a rebound for AUD and NZD. Once more we see EUR supported early in the European session, but can the cycle of sell-offs be broken and be translated into a recovery?
In commodities, gold continues to climb higher by +$3 (+0.2%), whilst oil is also supported and is over half a percent higher.
The key data on the economic calendar kicks off with UK CPI at 0930GMT. Headline UK CPI is expected to fall by -0.4% in January but this would still mean a year on year improvement to +1.6% (from +1.3% in December). Core UK CPI is expected to drop by -0.6% on the month but the year on year reading is expected to increase slightly to +1.5% (from +1.4% in December). Into the afternoon, the focus is on inflation for the US, but this time it is the PPI, or factory gate inflation.
US PPI is at 1330GMT and is expected to see headline PPI increase to +1.6% in January (from +1.3% in December), whilst core PPI is expected to pick up to +1.3% (from +1.1% in December). US Building Permits at 1330GMT are expected to increase slightly to 1.450m (from +1.420m in December). US Housing Starts are expected to fall to 1.425m (from 1.608m in December). The FOMC minutes for the January meeting are at 1900GMT where the focus will be on what the Fed had to say about the impact of the Coronavirus and inflation.
There are also a couple of Fed speakers to watch out for today. Neel Kashkari (voter, big dove) speaks at 1445GMT whilst Robert Kaplan (voter, centrist) speaks at 1830GMT.
Chart of the Day – German DAX
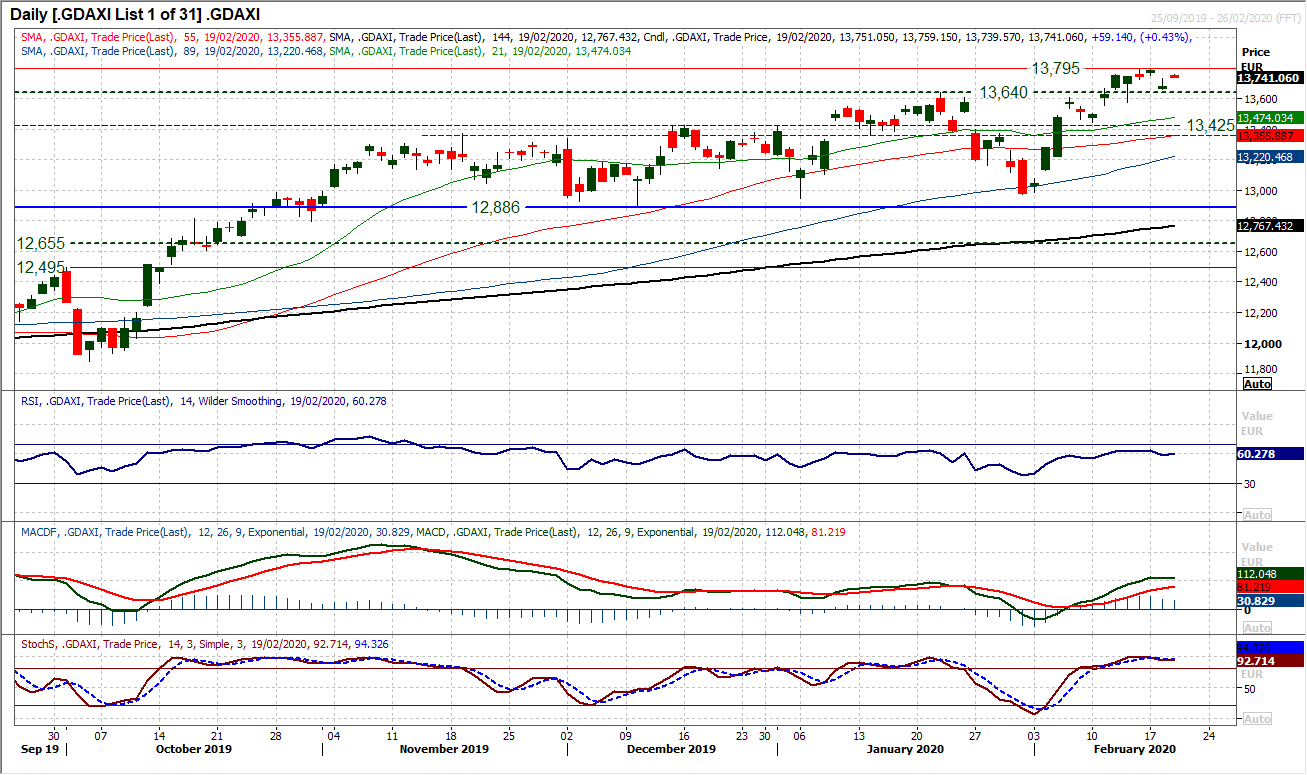
The fate of German equities seems to be somewhat decoupled from that of a sluggish German economy. The outlook for the DAX remains strong as it has been hitting all-time highs in recent days. The question is whether yesterday’s downside gap from 13,754 changes this. The fact is that cash DAX does gap around a lot, and it would appear that the technical analysis saying that “gaps close” for some reason does not seem to apply to the DAX. What does seem to be more relevant is that the DAX is paying attention to old pivot areas. So the support at 13,576/13,640 is the first basis that the bulls need to work from. This comes as the momentum indicators have taken note of yesterday’s slip, but with little real impact yet. The RSI has ticked back below 60 once more and Stochastics crossed lower, so these need watching now. Could this now begin a near term retracement again? Our base case is for weakness to be bought into on the DAX and the pivots of old breakout levels are supportive. With yesterday’s session opening at the low, the selling pressure never really took hold and that is a positive coming into today’s session. We look for support at 13,576 to hold and the bulls build once more for further moves on the all-time high of 13,795. The main support band near term is at 13,360/13,425.
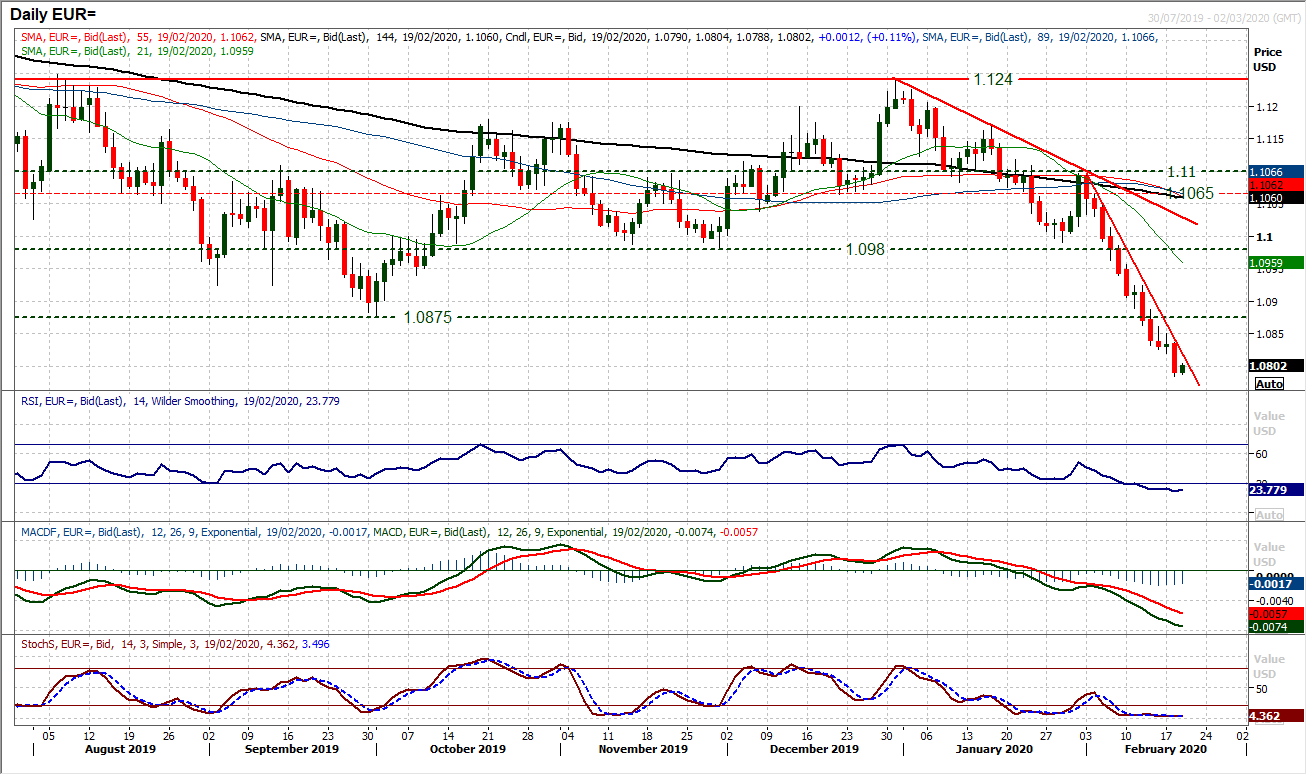
It is like Groundhog Day for the euro bulls right now. The European traders come in to build support, only for US traders to come in and smash it all down again. This has happened in almost every session for more than two weeks now. The downtrend formation today comes in at $1.0820 and is still a good basis of resistance. Momentum is still deeply oversold, with the RSI at 21 this morning, whilst MACD and Stochastics are also desperately negative. We have been discussing the prospect of a technical rally for a few days now and whilst this precipitous sell-off continues, there is daily hope that the support of the European session translates through to US trading. For now though, EUR/USD continues to fall at multi-year lows with little real support. There is an argument for $1.0775, however, realistically the next key support is $1.0490/$1.0560. The hourly chart shows resistance $1.0820/$1.0840 and until the hourly RSI is decisively above 60, a technical rally remains elusive.
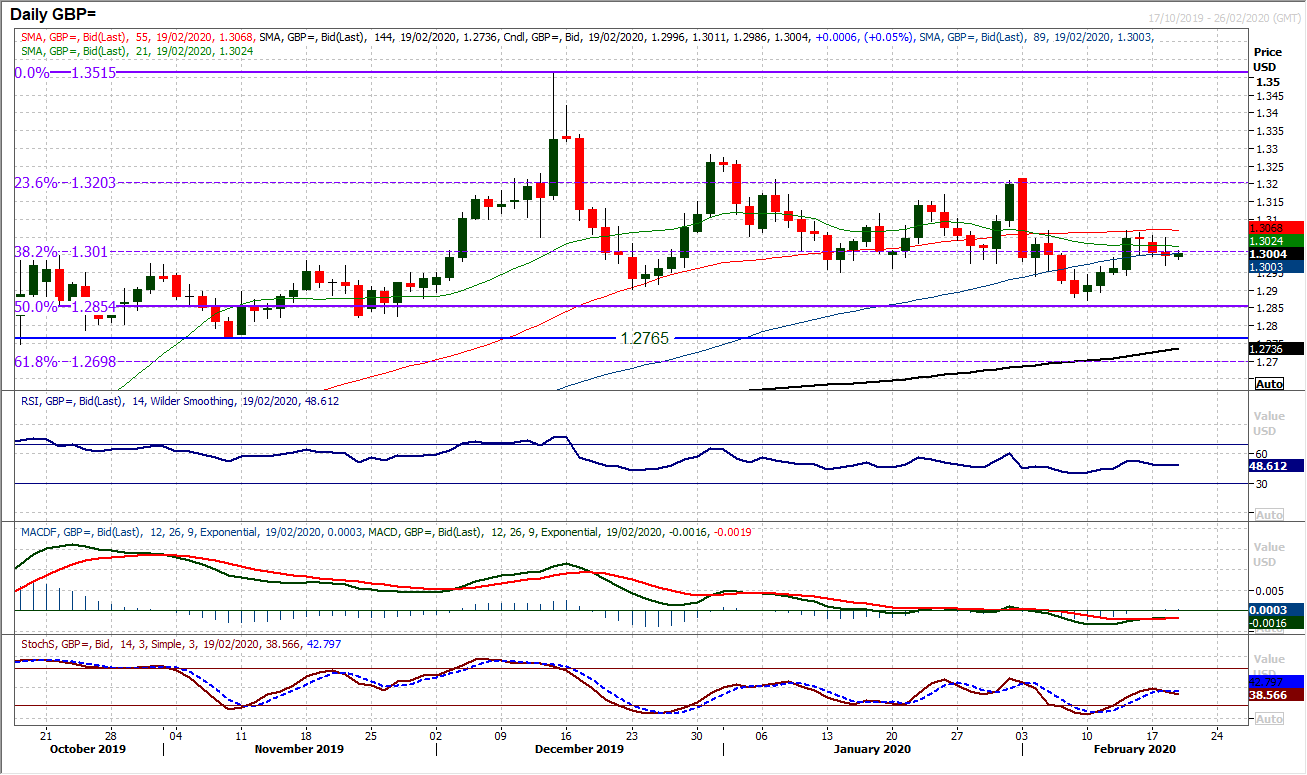
As has been the case on several occasions in recent weeks and months, the rally on Cable has rolled over and begun to retrace. The bulls will though note that the selling pressure is fairly thin right now and the negative candlesticks are small-bodied. Although momentum indicators have rolled over at their neutral points (RSI) or just below (MACD and Stochastics) which lends a near term negative bias, there is little real driving force behind the move. Resistance at $1.3070 was bolstered by yesterday’s $1.3050 lower high, however, the hourly chart shows support of the pivot band $1.2940/$1.2960 which is holding firm. The hourly momentum indicators are in ranging formation with hourly RSI oscillating between 30/70 which suggests that there is little traction either way right now. We are neutral medium term on Cable and increasingly neutral near term too.
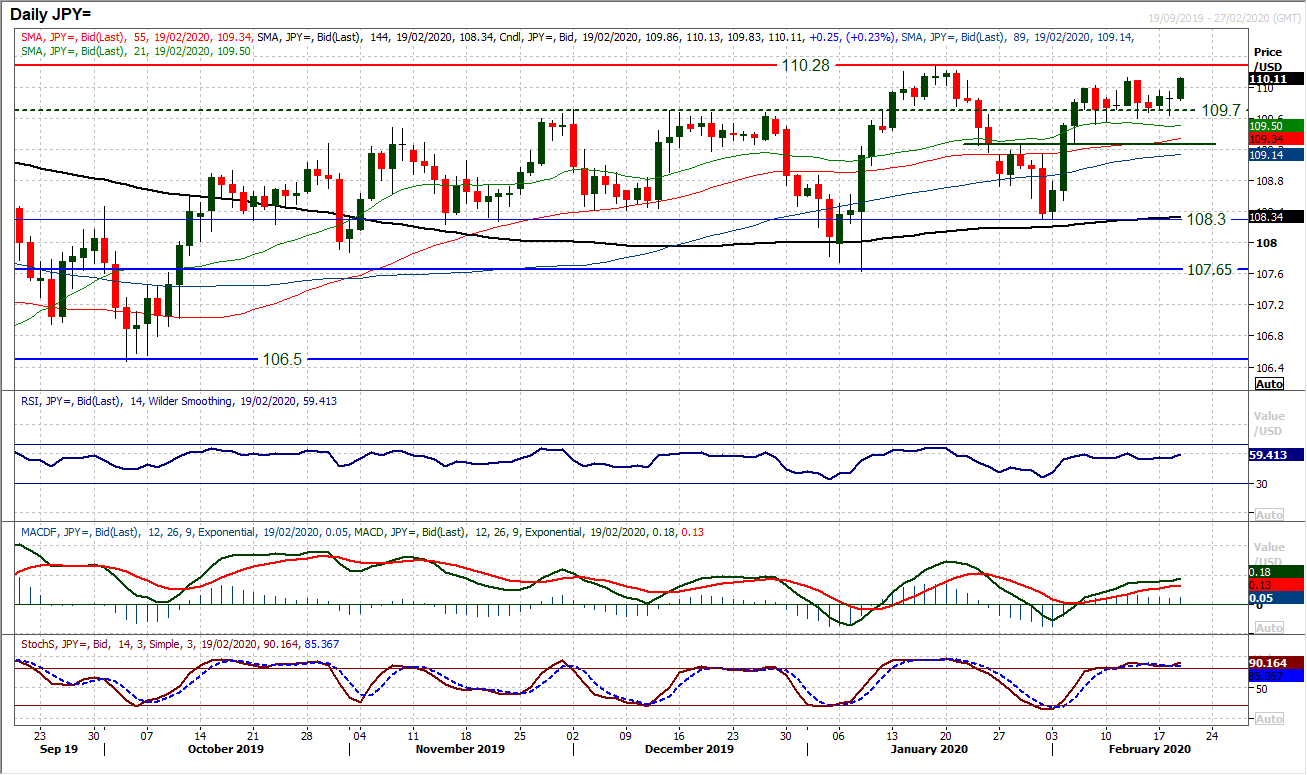
We have been covering the consolidation of the past two weeks and there is little sign that this consolidation is about to end. Indicators fluctuate between near term positive and negative bias as the market searches for conviction. Coming into today’s session the latest bias is turning mildly positive again. Even with a broad safe haven positive outlook yesterday, once more a slip below 109.70 was seen as a chance to buy and a doji candle would have been seen as a good result for the bulls. An early tick higher is testing resistance 110.00/110.15 and is resulting in a drift back higher on momentum. We remain positive on Dollar/Yen on the support 109.50/109.70 and see weakness as a chance to buy for pressure on 110.30 in due course. We would change our view on a closing breach of the pivot support at 109.25.
Gold
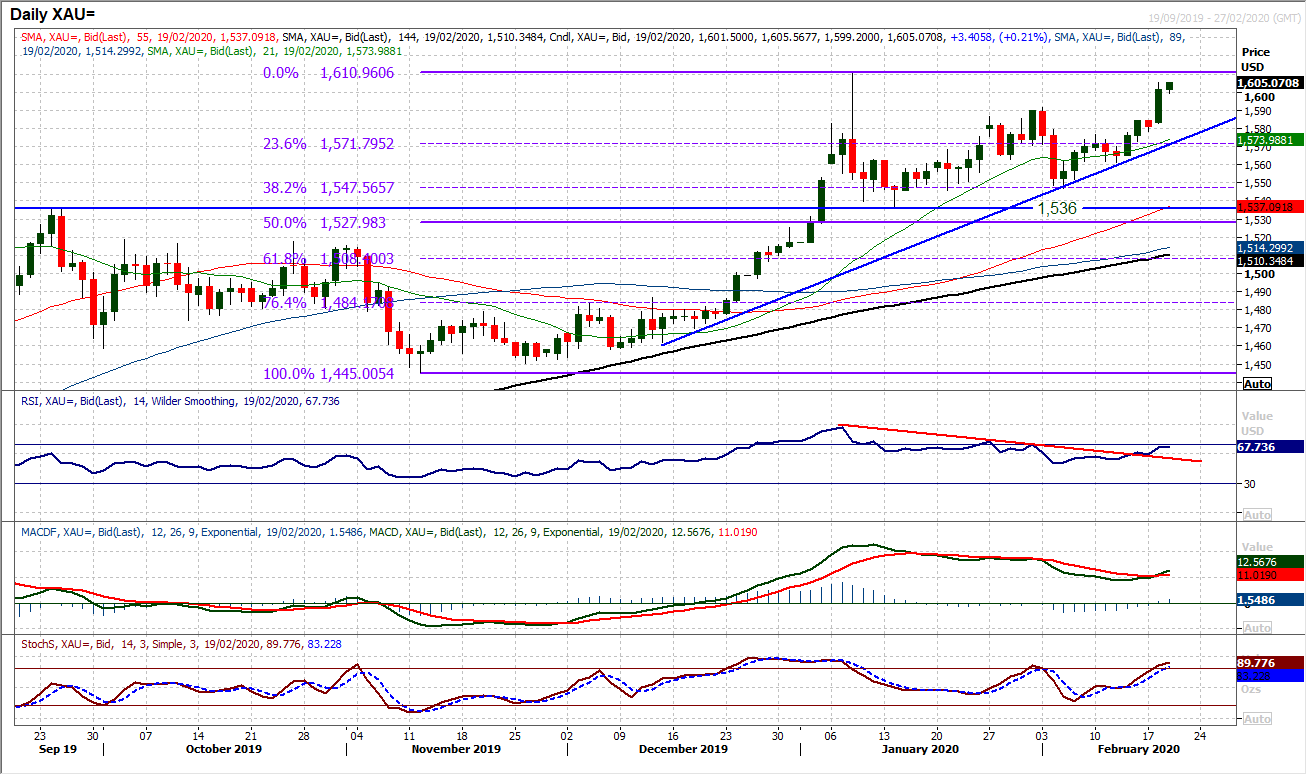
Breaking above $1577 we turned more positive on gold, but with the decisive move above $1591 resistance, we have increasing conviction. Yesterday’s closing level of $1601 was the highest close on gold since 2013 and brings the January spike high of $1611 right into focus. Our confidence levels are increased further looking at the strengthening momentum, with the RSI into the high 60s, a bull cross on MACD and Stochastics bullish into the 80s. We continue to see intraday weakness as a chance to buy and there is now a good band of support $1577/$1591. The two month uptrend comes in at $1571 today. The hourly chart shows a basis of consolidation early today, but the bulls are well-positioned to buy into weakness.
WTI Oil
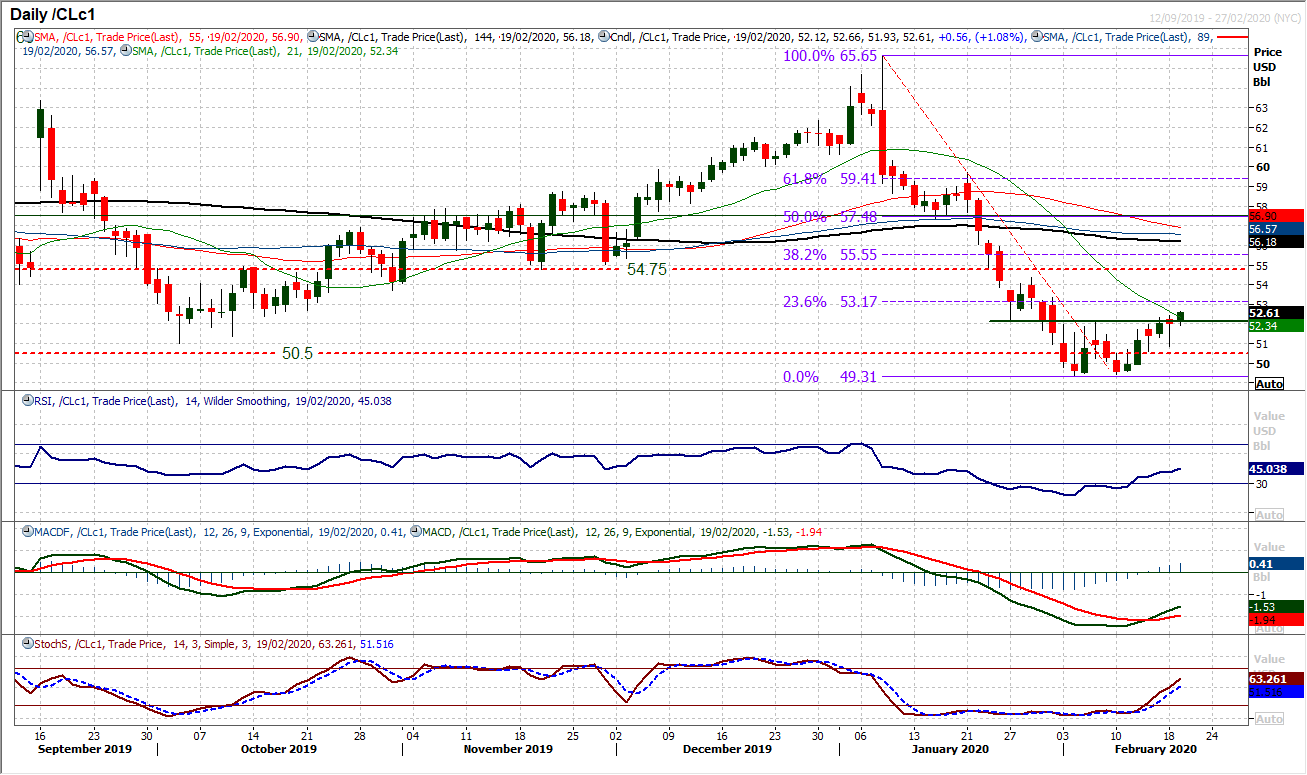
The development of this recovery is increasingly encouraging for the bulls. Throughout January we saw intraday rallies consistently being sold into. This has now completely flipped around, where we see intraday weakness as a chance to buy. A run of higher lows is now forming. The reaction of the bulls to first a drop to $50.60 and now during yesterday’s session to $50.90 shows there has been a change of sentiment on oil. There is a base pattern now completing above $52.15 which implies around $2.80 of further recovery towards the resistance band $54.75/$55.00. The conviction in the move is aided further, by an impressive turnaround in momentum, where MACD lines are moving higher following a bull cross, as are Stochastics. The 23.6% Fibonacci retracement (of $65.65/$49.30) around $53.15 is a barrier to overcome, but there really does seem to be some more steel to the bulls now. We are buyers into weakness and back a recovery towards $54.75/$55.00.
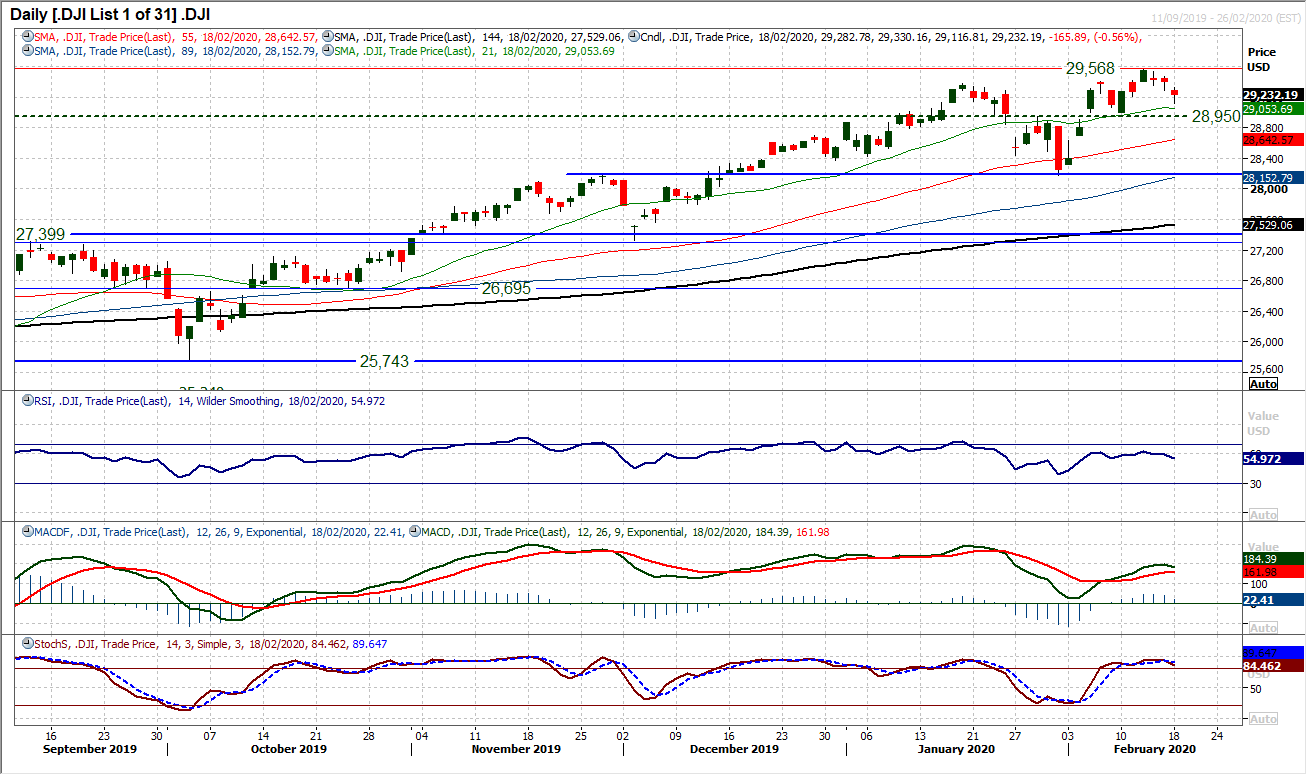
After a run of three consecutive sessions lower, the bulls will be wondering whether this is a mild unwind or a more considerable corrective move. The pivot support band 28,950/29,000 will be a key gauge now for the near to medium term outlook. With US futures suggesting the formation of support initially today, the reaction to any early gains will also be a signal. Daily momentum indicators are just beginning to tail off and if an intraday rally is sold into today, then this correction could continue to gather pace. The hourly chart is suggesting that this recent move has unwound stretched momentum and has helped to renew upside potential, but it is a fine balance now. A breach of 28,950 would be a corrective signal and the bulls would be looking to use yesterday’s low of 29,116 to build from. Resistance is at 29,400 to be breached for bulls to regain outright control. We still see weakness as a chance to buy for further pressure on the all-time high of 29,568.
"""DISCLAIMER: This report does not constitute personal investment advice, nor does it take into account the individual financial circumstances or objectives of the clients who receive it. All information and research produced by Hantec Markets is intended to be general in nature; it does not constitute a recommendation or offer for the purchase or sale of any financial instrument, nor should it be construed as such.
All of the views or suggestions within this report are those solely and exclusively of the author, and accurately reflect his personal views about any and all of the subject instruments and are presented to the best of the author’s knowledge. Any person relying on this report to undertake trading does so entirely at his/her own risk and Hantec Markets does not accept any liability. """
