Market Overview
A couple of weeks ago, markets were all giddy with anticipation of deals. A prospective trade deal between US and China, in addition to a prospective Brexit deal. The reality of politics delivering on what seems to be two very difficult agreements has taken the steam out of major market moves. However, despite the volatility seeping away, there is still a sense that something has changed in both the trade dispute and the Brexit process. On trade, the noises coming from both camps are still positive. Larry Kudlow added to this by noting that the potential for the December trade tariffs to be cancelled if the trade talks go well. This is helping to lend a more positive bias once more to market moves. On the Brexit side, there is a frustration with the progress in the UK Parliament, but one thing has emerged in that the prospects of a “no deal” hardest of Brexits, has reduced. Delay would be tedious and is increasingly likely, but a reduced threat of the nuclear option has helped to sustain a significant sterling rebound.
It is interesting to see improved risk appetite and traders leaning away from safer haven options. Treasury yields ticking higher, whilst gold and the Japanese yen have edged lower. A positive bias is also supportive for equities which also have the ramping up of earnings season to contend with. Although definitive direction is still hard to come by, there are signs of positive risk taking hold.
Wall Street closed with solid gains last night with the S&P 500 +0.7% and closing above 3000 for the first time in over a month (at 3007). US futures are showing a continued move higher with +0.2% today. Asian markets have been mildly positive with the Shanghai Composite +0.2% (Japan was closed for public holiday). European markets are trading cautiously higher, with the DAX Futures +0.1% and FTSE Futures all but flat.
In forex, there is a very uncertain look today with little real direction on USD, with mild gains on GBP whilst NZD is the main outperformer.
In commodities, gold and silver are fluctuating around the flat line, whilst oil is a shade lighter.
It is a relatively quiet day for the economic calendar today. The UK Public Sector Net Borrowing for September is at 09:30 BST which is expected to show a deficit of £8.8bn (deficit of £2.0bn in the equivalent month of 2018). Into the US session, the Existing Home Sales at 15:00 BST is expected to show a decline of -0.7% in September to 5.45m (from 5.49m in August). The Richmond Fed Comp index is at 15:00 BST and is expected to improve slightly to -7 in October (from -9 in September).
Chart of the Day – Silver
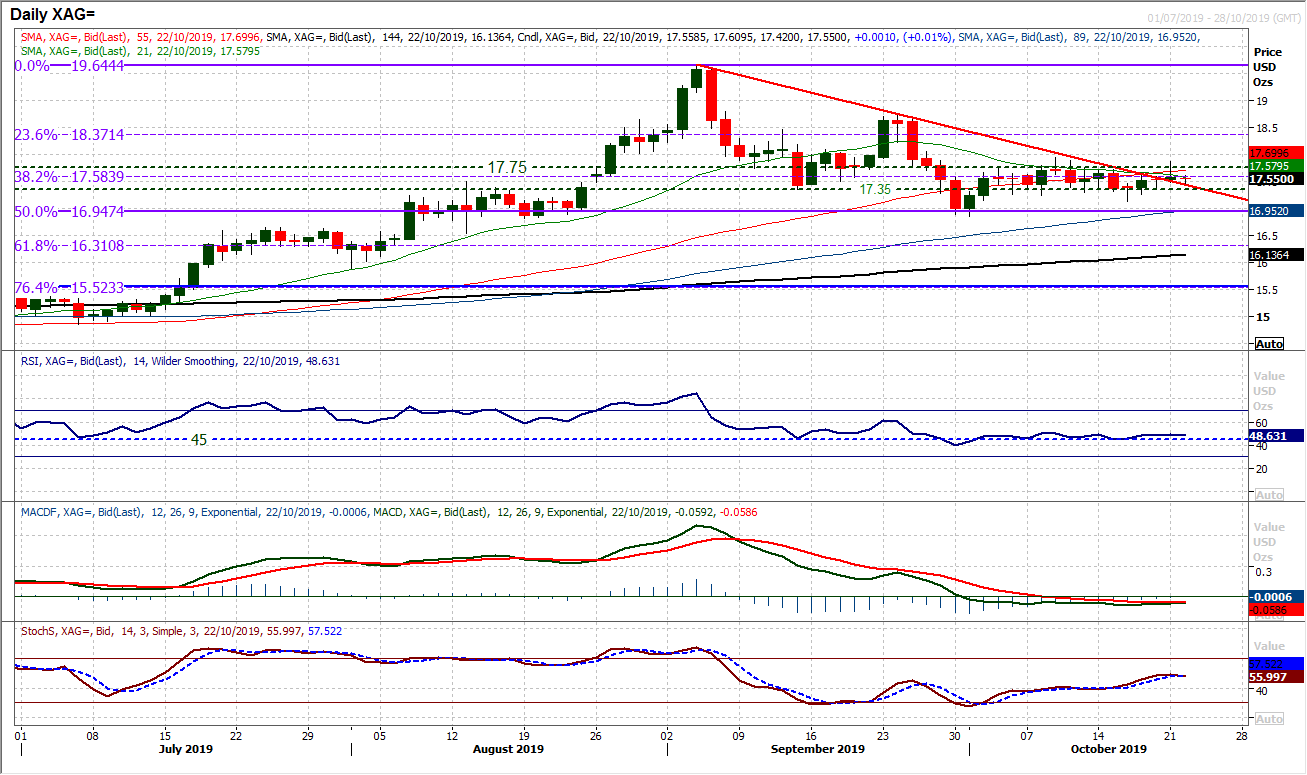
Both silver and gold have been stuck in a rut in recent weeks with precious little sign of any decisive direction. However, are we starting to see silver lead the way higher? A consolidation has driven the market sideways for more than two weeks, but has now broke a downtrend in place since September. This also comes with positive traction beginning to develop on the Stochastics (rising above 50 and at a six week high). However, it is still very early to call recovery. Yesterday’s candlestick would have been mildly disappointing as the bulls gave up a strengthening position as a mini breakout above $17.75 failed. With RSI stuck around 50 and MACD lines flat, this may have been a bit of a false dawn. However, it is important that the market holds above $17.35 support now. It also looks as though intraday corrections are being bought into. The hourly chart shows MACD consistently positioning above neutral for the past three sessions whilst the hourly RSI is consistently above 40. A basis of support is forming $17.35/$17.50. Too early to call a rally, but early signs are developing.
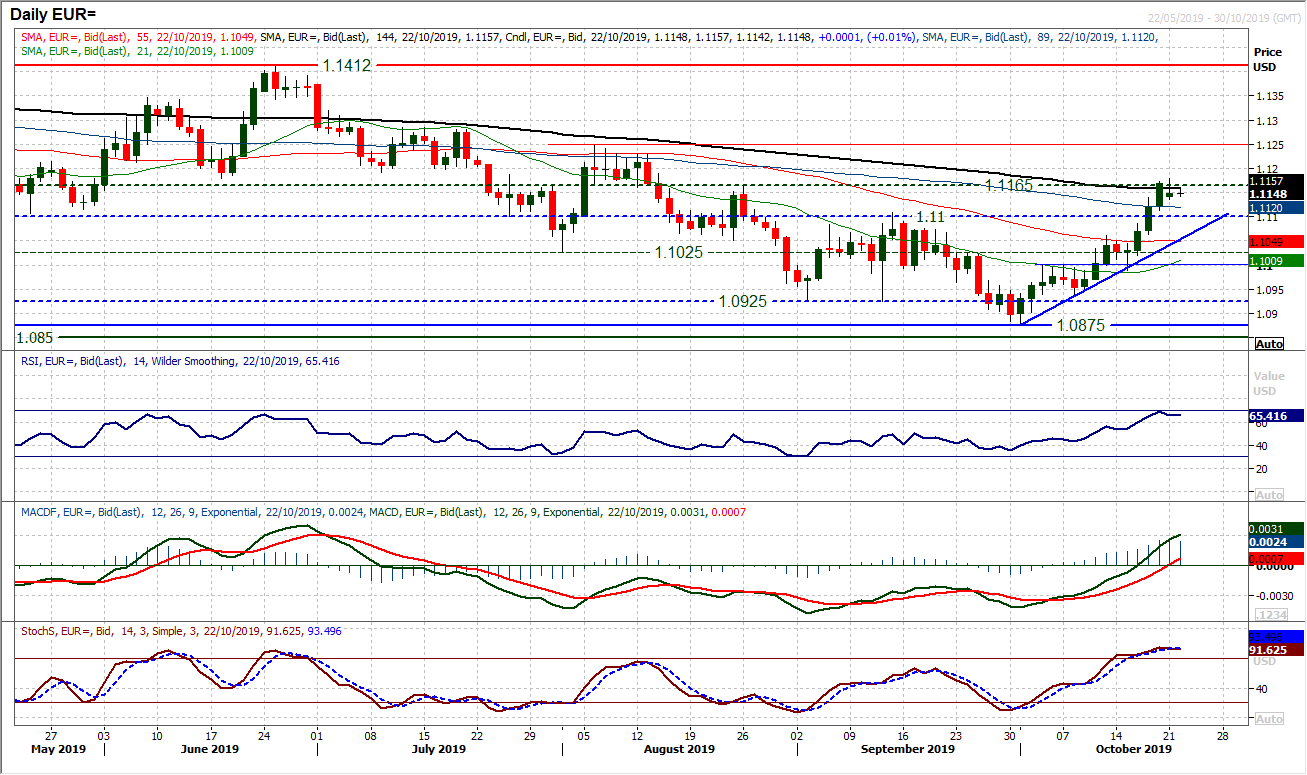
The rally on EUR/USD is holding despite yesterday’s lower close. An open lower could have been seen as an excuse by the bulls to lock in some recent profits, but the support continues to hold. With another (marginally) positive candle (close above the open) the appetite to control the market is still there for the bulls. Momentum is subsequently still positive as MACD lines swing decisively above neutral and RSI hovers in the mid to high 60s. The breakout support around $1.1100 is set to be a key near term gauge, whilst the now three week uptrend comes in at $1.1050 today. We look to buy into weakness. A close clear of the $1.1165 resistance would open the next key test of the $1.1250 August high. The hourly chart shows a consistent run of using old breakouts as support, leaving a support band initially $1.1100/$1.1135.
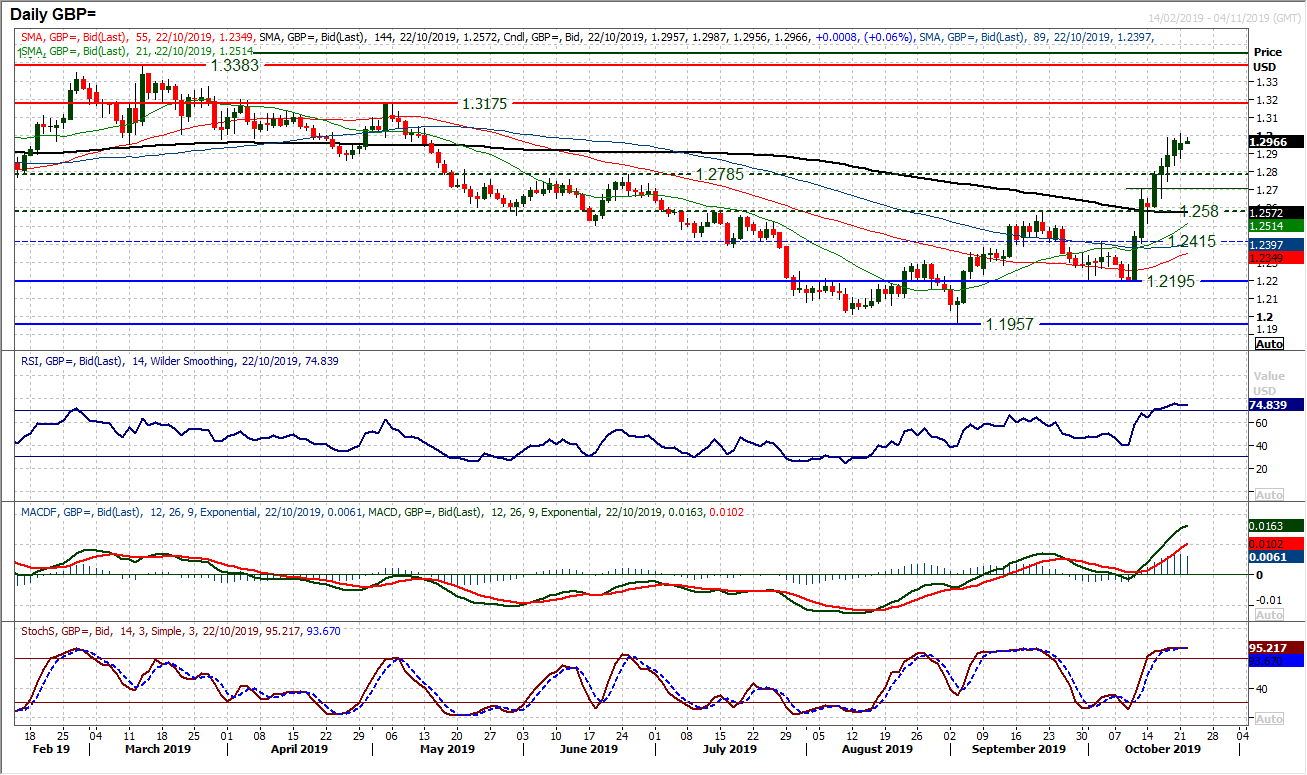
Sterling is staying strong as the market continues to flirt with $1.3000 again. The continued intent to buy into intraday weakness is an incredible feature of the past four sessions, leading to a run of seven consecutive higher daily lows. Momentum is holding strong on both the daily and hourly charts. The hourly chart also shows how a seven day uptrend is holding firm, whilst the 55 hour moving average (at $1.2935 this morning) is a great gauge of support. There is a risk that the sharp bull moves higher are just beginning to dissipate now though, with the magnitude of the intraday moves just easing now. This could set in for a degree of consolidation. The risk of profit taking would be rising, with yesterday’s low at $1.2875 the support to watch. The 55 hour moving average is also an early gauge too. A close above $1.3000 would be a strong signal for the bulls and would then open the next resistance at $1.3175.
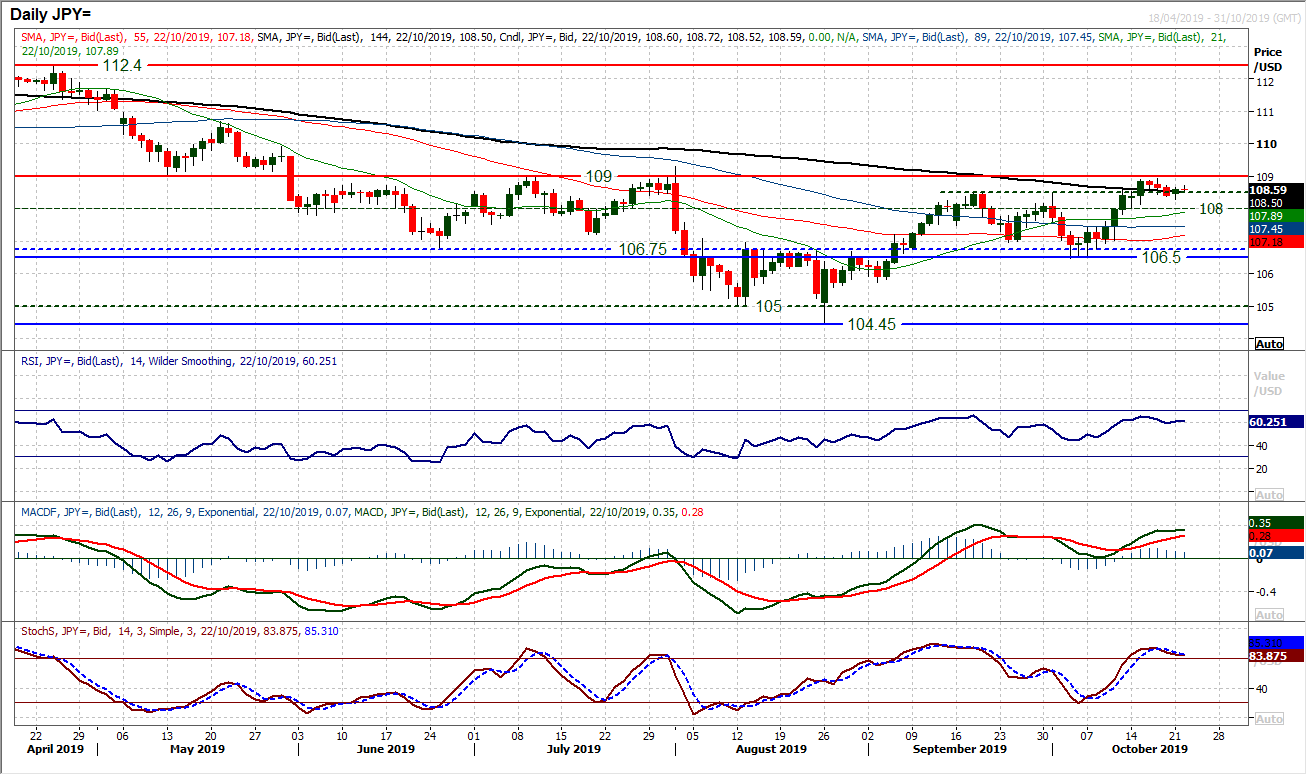
A slide back on the dollar took pause for thought yesterday with a mild positive candlestick on Dollar/Yen. This helps to build up the importance of the support around 108.50 (the old September resistance). Although momentum has lost its impetus in the past few sessions, the continued reaction around the old September highs will be an important gauge. There is still a likelihood that this is part of a broad range play between 106.50/109.00. Given the point at which momentum indicators have rolled over, the current outlook has the hallmarks of a mild positive near term bias within a building medium term consolidation. The game changer would be a decisive breakout above the key resistance at 109.00. The next couple of sessions could be a strong gauge as to the potential for this. The bulls beginning to take control again today would be a start in this. Initial support at yesterday’s low at 108.30, whilst a move under 108.00 would once more neutralise the outlook.
Gold
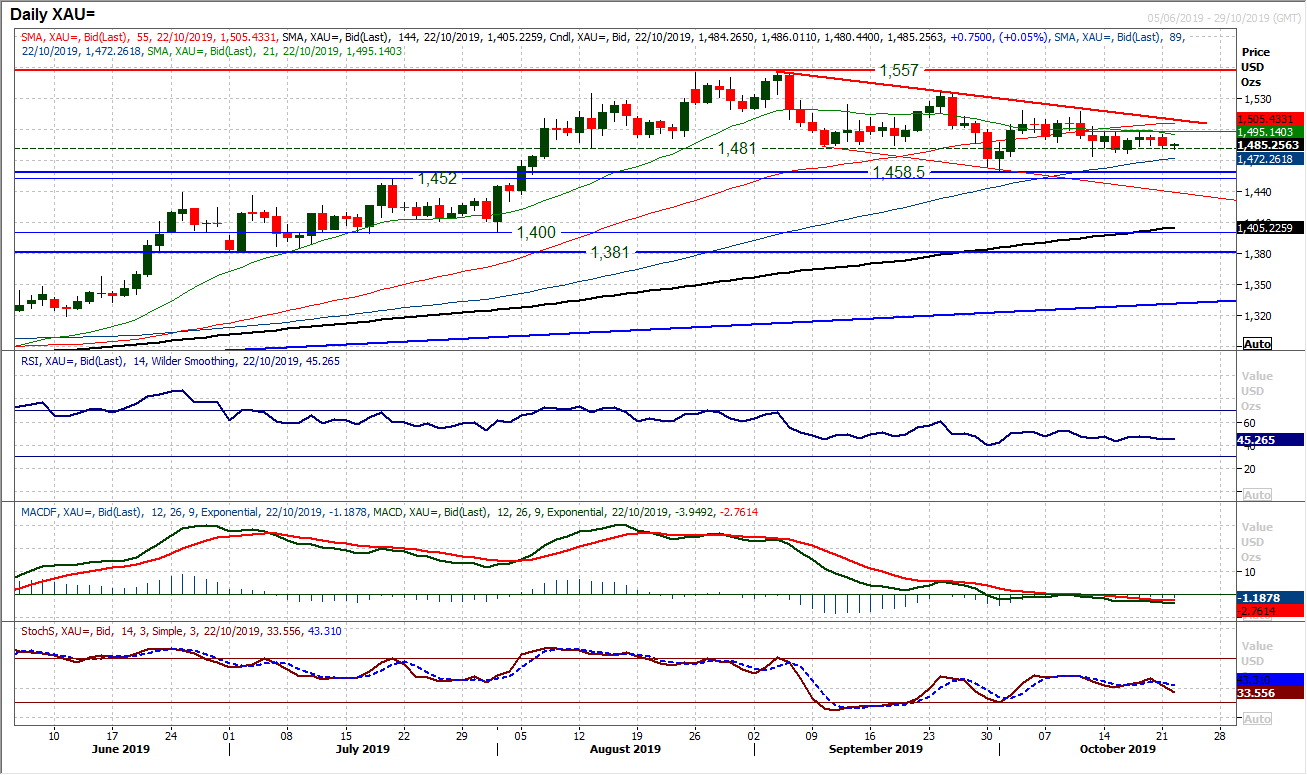
Gold continues to lack any decisive direction as yet another candlestick formed within the limits of trading of the past week. The market has played out between $1474 support and $1497 resistance for the past six sessions. Momentum indicators have become increasingly stagnant recently, although after yesterday’s negative close, there is just a sense of a bear bias beginning to seep into the market once more. RSI is drifting back from 50, whilst the MACD lines are on the drift under the flat line. Resistance at $1497 is being bolstered and there is another drift back towards the old $1481 key support. A close below $1481 would open the key low at $1458 again, however, the intraday low at $1474 is initial support. This is reflected on the hourly chart which continues to show a lack of real intent. Whilst a slight negative edge has formed in the early part of this week, this is still not a market with any real conviction.
WTI Oil
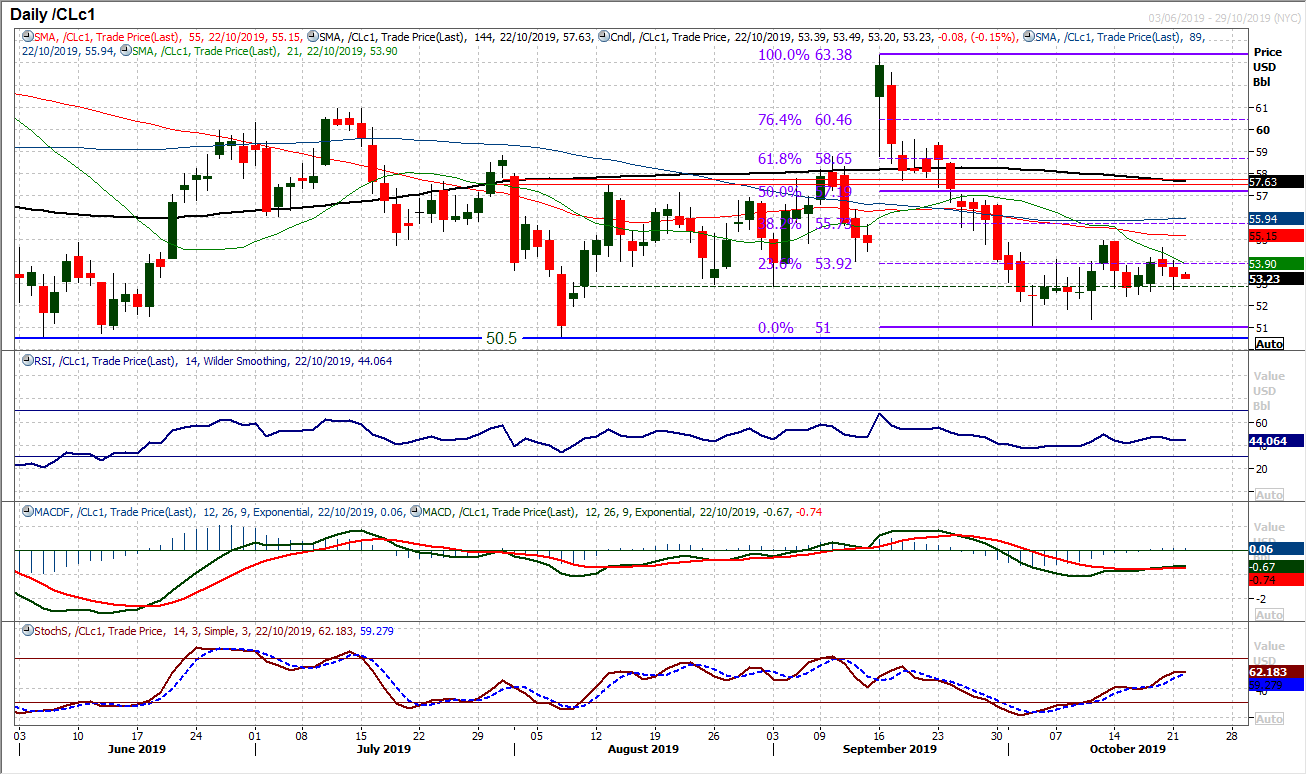
We discussed previously about the attraction that WTI has to the old support at $52.85 and once more a consolidation has taken over a threatened sense of direction. A couple of mild negative candles have pulled the reins on the positivity from the middle of last week. The market currently sits back in its consolidation area $52.85/$53.90 (the latter being the 23.6% Fibonacci retracement of $63.40/$51.00). With a subdued nature to the momentum indicators (RSI between 40/50 for the past 8 sessions, MACD lines flat), the search for direction and conviction continues. This is a range play, with support at $51.00 and initially at last week’s low at $52.40, whilst resistance is now key around $54.90 and last week’s high of $54.60.
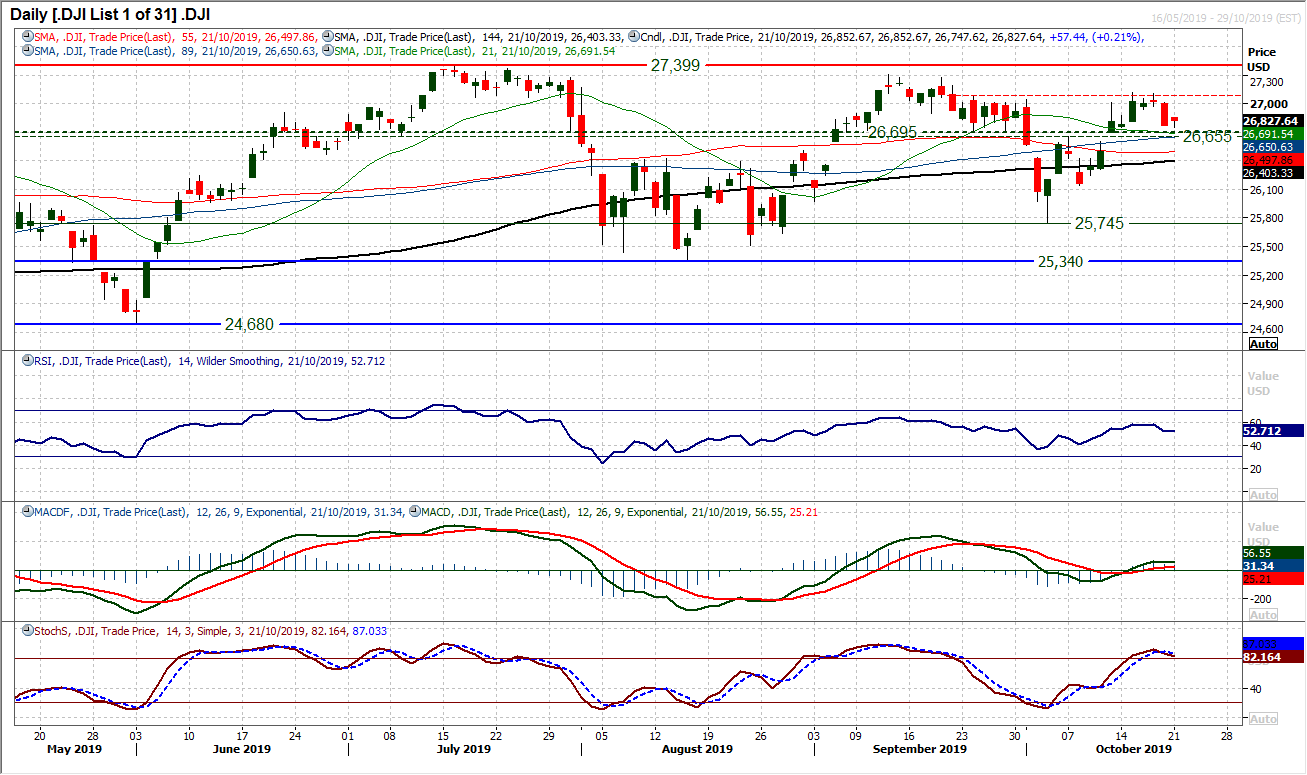
There has been a degree of support coming in for the Dow again as the pivot around 26,655/26,695 helps to settle the nerves for the bulls. However, it was a far from convincing candlestick in yesterday’s session. Despite closing higher on the day, the bulls never managed to get any traction in a rebound. Given the failing recovery on momentum indicators, there is a sense that the market is finding conditions far from plain sailing. There is a risk that the outlook could turn sour if there were to be any further negative sessions. For now though, trading above the 26,655/26,695 support area and moving averages will lend a marginal positive bias to the outlook, but the bulls are lacking conviction. Resistance overhead between 27,045/27,120 will be the big near term test.
"""DISCLAIMER: This report does not constitute personal investment advice, nor does it take into account the individual financial circumstances or objectives of the clients who receive it. All information and research produced by Hantec Markets is intended to be general in nature; it does not constitute a recommendation or offer for the purchase or sale of any financial instrument, nor should it be construed as such.
All of the views or suggestions within this report are those solely and exclusively of the author, and accurately reflect his personal views about any and all of the subject instruments and are presented to the best of the author’s knowledge. Any person relying on this report to undertake trading does so entirely at his/her own risk and Hantec Markets does not accept any liability. """
